WISKUNDE
GRAAD 10
NOG OEFENINGE
Grafieke van eksponensiële funksies : antwoorde.
GRAAD 10
NOG OEFENINGE
Grafieke van eksponensiële funksies : antwoorde.
MATHEMATICS
GRADE 10
MORE EXERCISES
Graphs of exponential functions : answers.
GRADE 10
MORE EXERCISES
Graphs of exponential functions : answers.
Die horisontale asimptoot : q = 0 en dus y = 0
The horizontal asymptote : q = 0 and therefore y = 0
a = 1 en dus is die grafiek bokant die horisontale
asimptoot, y = 0
a = 1 and therefore the graph is above the horizontal
asymptote, y = 0
3 > 1 en dus b > 1 sodat die grafiek stygend is.
3 > 1 and thus b > 1 so that the graph is increasing.
Y-afsnit : y = 30 = 1
Y-afsnit is (0 ; 1)
Y-intercept : y = 30 = 1
Y-intercept is (0 ; 1)
Die horisontale asimptoot : q = 0 en dus x = 0
The horizontal asymptote : q = 0 and therefore x = 0
a = 1 en dus is die grafiek bokant die horisontale
asimptoot, y = 0
a = 1 and therefore the graph is above the horizontal
asymptote, y = 0
½ < 1 en dus 0 < b < 1 sodat die grafiek dalend is.
½ < 1 and thus 0 < b < 1 so that the graph
is decreasing.
Y-afsnit : y = 2−0 = 1
Y-afsnit is (0 ; 1)
Y-intercept : y = 2−0 = 1
Y-intercept is (0 ; 1)
Die horisontale asimptoot : q = 0 en dus x = 0
The horizontal asymptote : q = 0 and therefore x = 0
a = 1 en dus is die grafiek bokant die horisontale
asimptoot, y = 0
a = 1 and therefore the graph is above the horizontal
asymptote, y = 0
1
— < 1 en dus 0 < b < 1 sodat die grafiek dalend is.
5
1
— < 1 and thus 0 < b < 1 so that the graph
5
is decreasing.
╭ 1 ╮0
Y-afsnit : y = │ — │ = 1
╰ 5 ╯
Y-afsnit is (0 ; 1)
╭ 1 ╮0
Y-intercept : y = │ — │ = 1
╰ 5 ╯
Y-intercept is (0 ; 1)
Die horisontale asimptoot : q = 1 en y = 1
The horizontal asymptote : q = 1 and y = 1
a = 1 en dus is die grafiek bokant die horisontale
asimptoot, y = 1
a = 1 and therefore the graph is above the horizontal
asymptote, y = 1
4 > 1 en dus b > 1 sodat die grafiek styg.
4 > 1 and thus b > 1 so that the graph
is increasing.
Y-afsnit : y = 40 + 1 = 1 + 1 = 2
Y-afsnit is (0 ; 2)
Y-intercept : y = 40 + 1 = 1 + 1 = 2
Y-intercept is (0 ; 2)
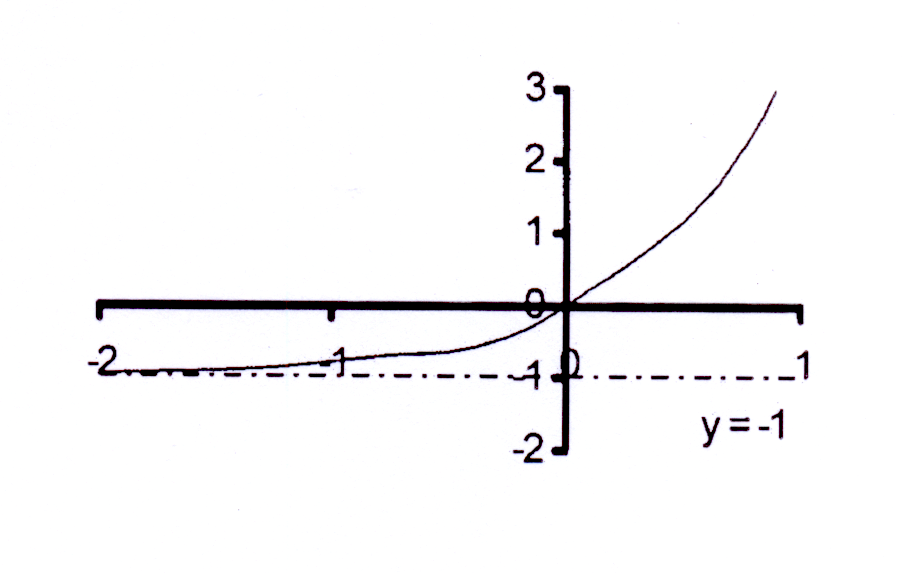
Die horisontale asimptoot : q = −1 en y = −1
The horizontal asymptote : q = −1 and y = −1
a = 1 en dus is die grafiek bokant die horisontale
asimptoot, y = −1
a = 1 and therefore the graph is above the horizontal
asymptote, y = −1
5 > 1 en dus b > 1 sodat die grafiek styg.
5 > 1 and thus b > 1 so that the graph
is increasing.
Y-afsnit : y = 50 − 1 = 1 − 1 = 0
Y-afsnit is (0 ; 0)
Y-intercept : y = 50 − 1 = 1 − 1 = 0
Y-intercept is (0 ; 0)
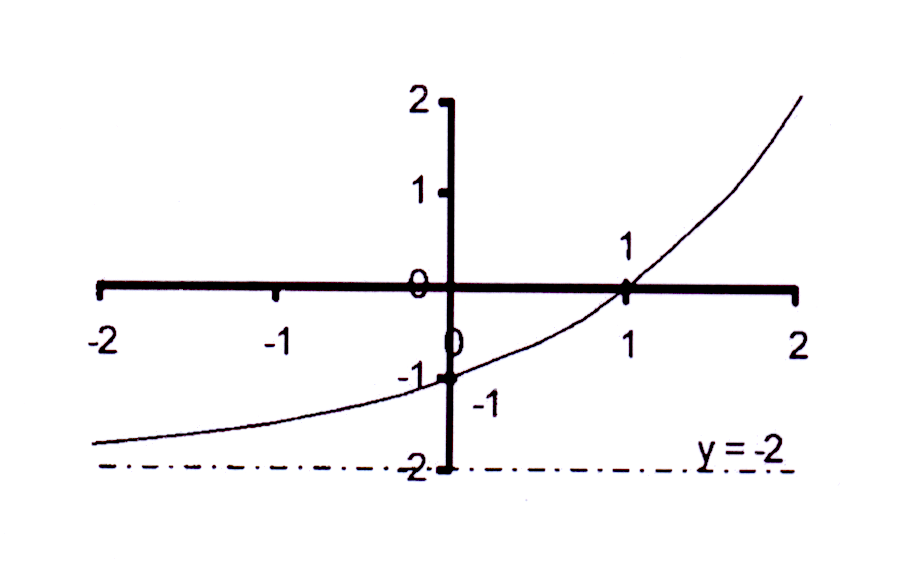
Die horisontale asimptoot : q = −2 en y = −2
The horizontal asymptote : q = −2 and y = −2
a = 1 en dus is die grafiek bokant die horisontale
asimptoot, y = −2
a = 1 and therefore the graph is above the horizontal
asymptote, y = −2
2 > 1 en dus b > 1 sodat die grafiek styg.
2 > 1 and thus b > 1 so that the graph
is increasing.
Y-afsnit : y = 20 − 2 = 1 − 2 = −1
Y-afsnit is (0 ; −1)
Y-intercept : y = 20 − 2 = 1 − 2 = −1
Y-intercept is (0 ; −1)
Die horisontale asimptoot : q = 0 en y = 0
The horizontal asymptote : q = 0 and y = 0
a = 3 en dus is die grafiek bokant die horisontale
asimptoot, y = 0
a = 3 and therefore the graph is above the horizontal
asymptote, y = 0
3 > 1 en dus b > 1 sodat die grafiek styg.
3 > 1 and thus b > 1 so that the graph
is increasing.
Y-afsnit : y = 3 × 20 = 3 × 1 = 3
Y-afsnit is (0 ; 3)
Y-intercept : y = 3 × 20 = 3 × 1 = 3
Y-intercept is (0 ; 3)
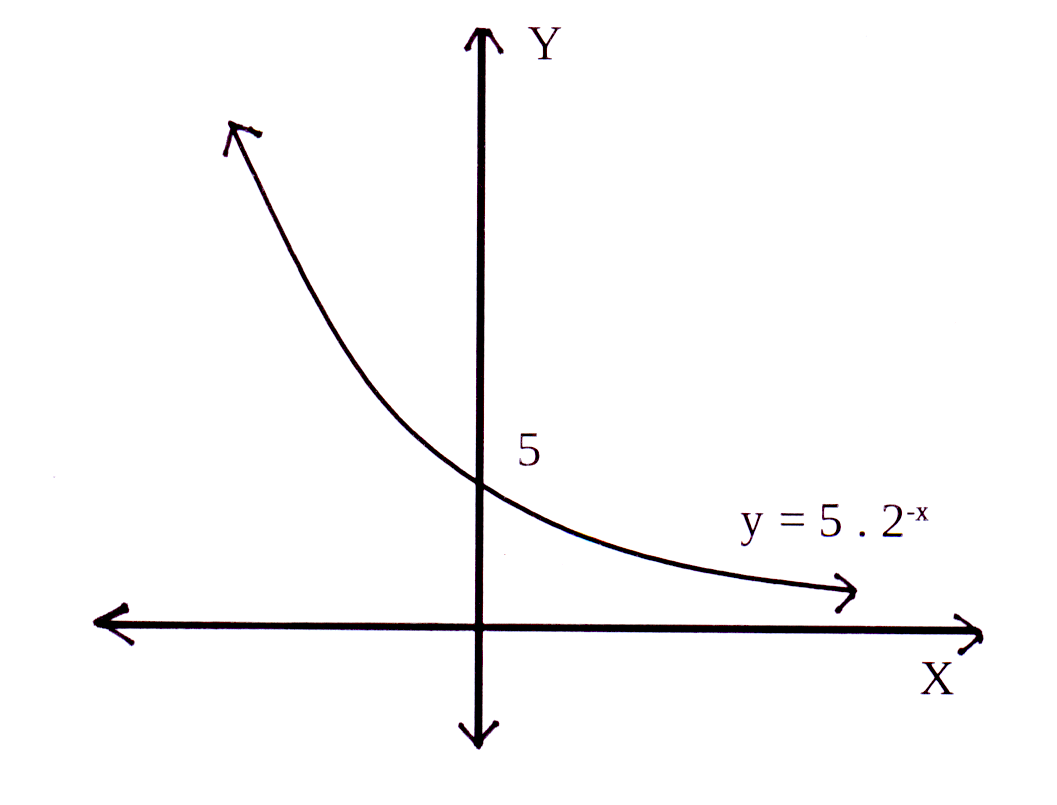
Die horisontale asimptoot : q = 0 en y = 0
The horizontal asymptote : q = 0 and y = 0
a = 5 en dus is die grafiek bokant die horisontale
asimptoot, y = 0
a = 5 and therefore the graph is above the horizontal
asymptote, y = 0
2-1 < 1 en dus 0 < b < 1 sodat die grafiek daal.
2-1 < 1 and thus 0 < b < 1 so that the graph
is decreasing.
Y-afsnit : y = 5 × 20 = 5 × 1 = 5
Y-afsnit is (0 ; 5)
Y-intercept : y = 5 × 20 = 5 × 1 = 5
Y-intercept is (0 ; 5)
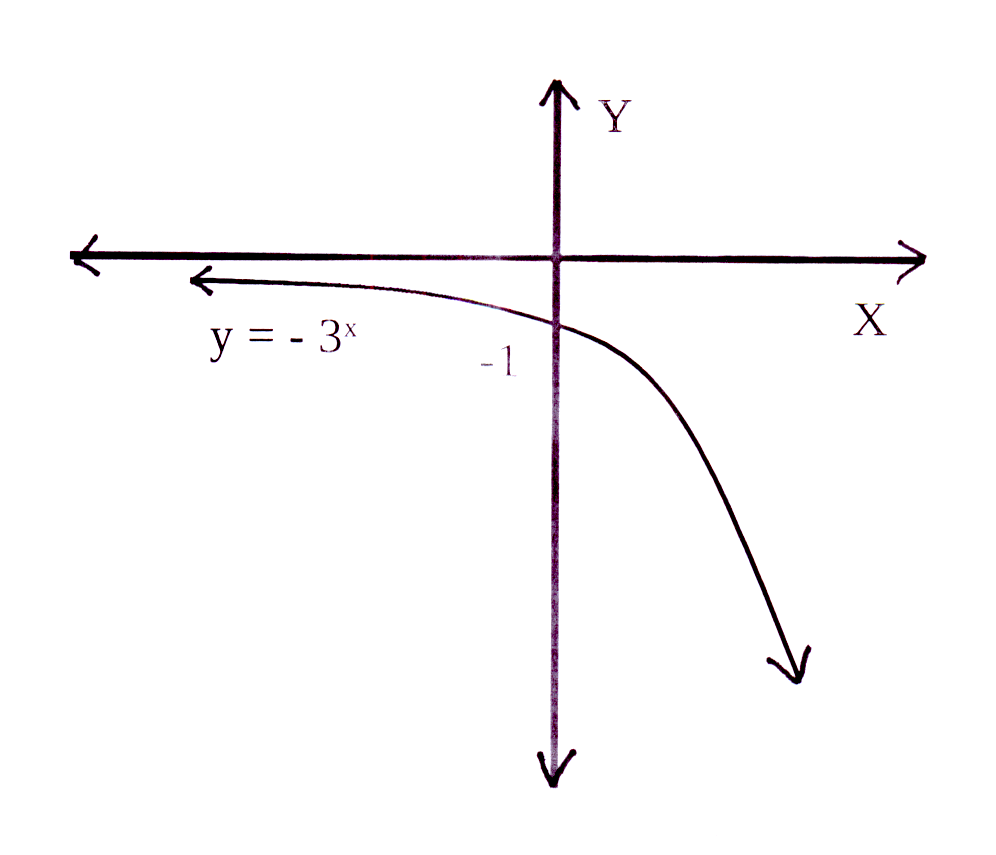
Die horisontale asimptoot : q = 0 en y = 0
The horizontal asymptote : q = 0 and y = 0
a = −1 en dus is die grafiek onderkant die horisontale
asimptoot, y = 0
a = −1 and therefore the graph is below the horizontal
asymptote, y = 0
3 > 1 en dus b > 1 sodat die grafiek styg.
3 > 1 and thus b > 1 so that the graph
is increasing.
Y-afsnit : y = −1 × 30 = −1 × 1 = −1
Y-afsnit is (0 ; −1)
Y-intercept : y = −1 × 30 = −1 × 1 = −1
Y-intercept is (0 ; −1)
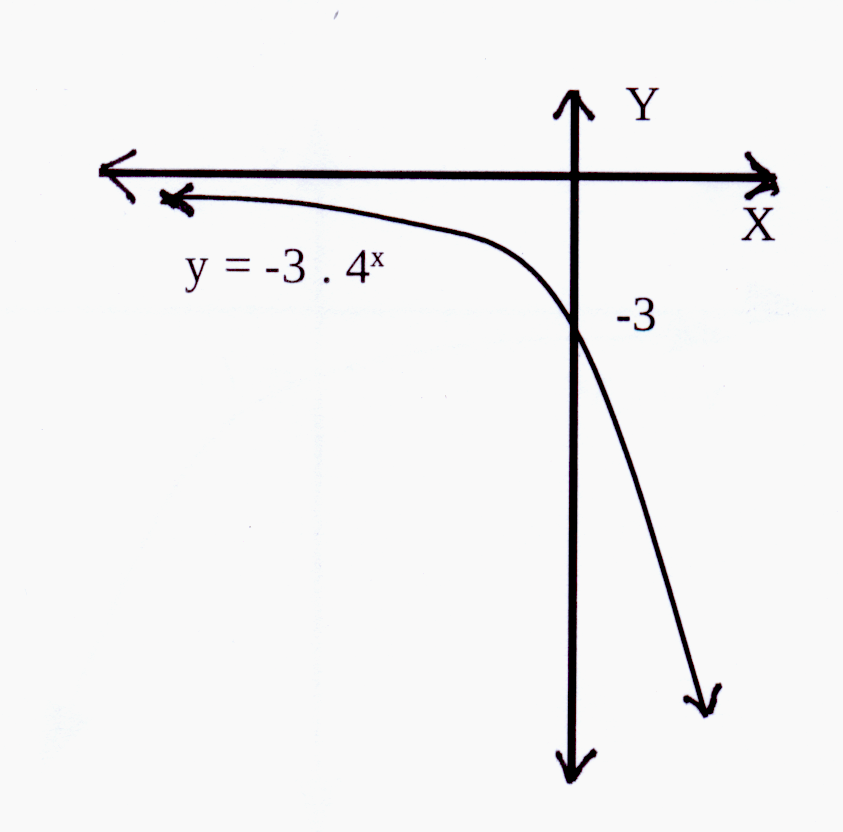
Die horisontale asimptoot : q = 0 en y = 0
The horizontal asymptote : q = 0 and y = 0
a = −3 en dus is die grafiek onderkant die horisontale
asimptoot, y = 0
a = −3 and therefore the graph is below the horizontal
asymptote, y = 0
4 > 1 en dus b > 1 sodat die grafiek styg.
4 > 1 and thus b > 1 so that the graph
is increasing.
Y-afsnit : y = −3 × 40 = −3 × 1 = −3
Y-afsnit is (0 ; −3)
Y-intercept : y = −3 × 40 = −3 × 1 = −3
Y-intercept is (0 ; −3)
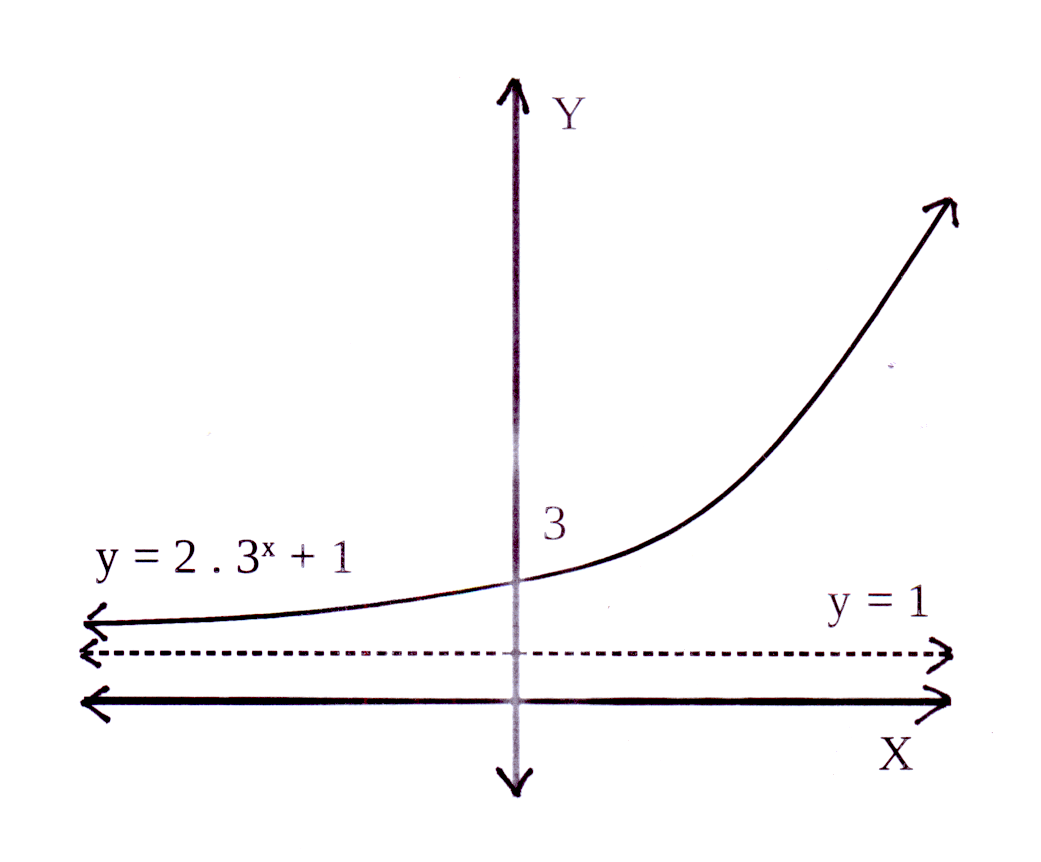
Die horisontale asimptoot : q = 1 en y = 1
The horizontal asymptote : q = 1 and y = 1
a = 2 en dus is die grafiek bokant die horisontale
asimptoot, y = 1
a = 2 and therefore the graph is above the horizontal
asymptote, y = 1
3 > 1 en dus b > 1 sodat die grafiek styg.
3 > 1 and thus b > 1 so that the graph
is increasing.
Y-afsnit : y = 2 × 30 + 1 = 2 × 1 + 1 = 3
Y-afsnit is (0 ; 3)
Y-intercept : y = 2 × 30 + 1 = 2 × 1 + 1 = 3
Y-intercept is (0 ; 3)
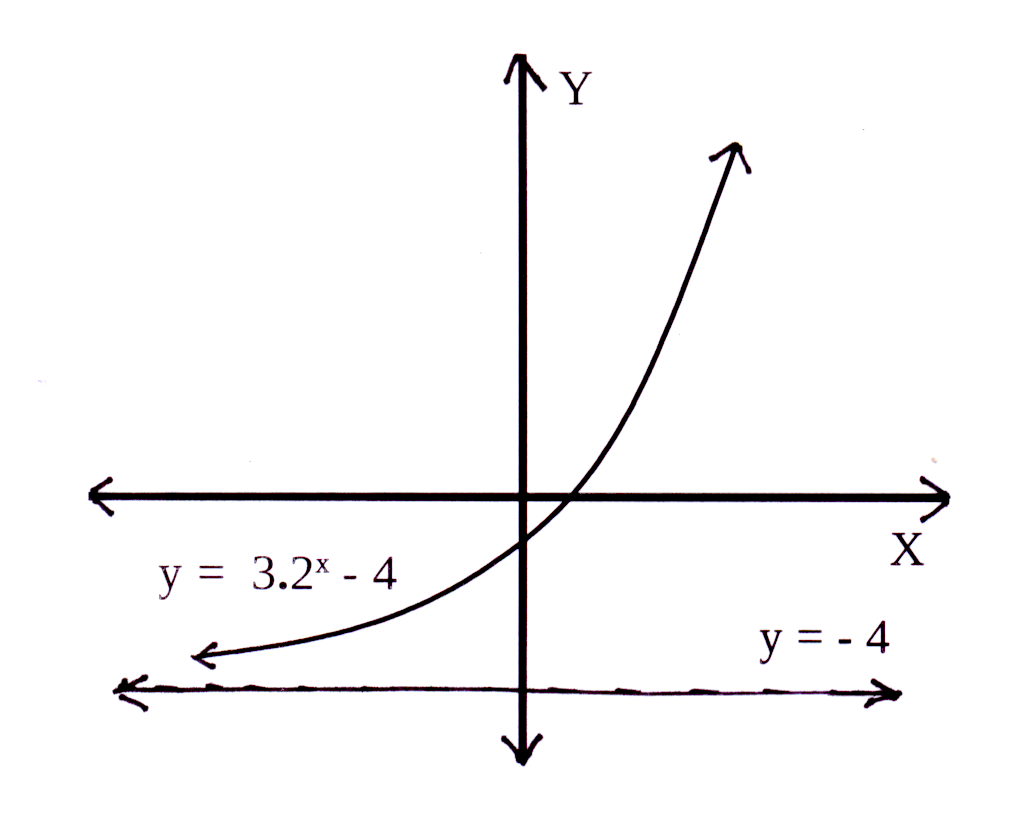
Die horisontale asimptoot : q = −4 en y = −4
The horizontal asymptote : q = −4 and y = −4
a = 3 en dus is die grafiek bokant die horisontale
asimptoot, y = −4
a = 3 and therefore the graph is above the horizontal
asymptote, y = −4
2 > 1 en dus b > 1 sodat die grafiek styg.
2 > 1 and thus b > 1 so that the graph
is increasing.
Y-afsnit : y = 3 × 20 − 4 = 3 × 1 − 4 = −1
Y-afsnit is (0 ; −1)
Y-intercept : y = 3 × 20 − 4 = 3 × 1 − 4 = −1
Y-intercept is (0 ; −1)
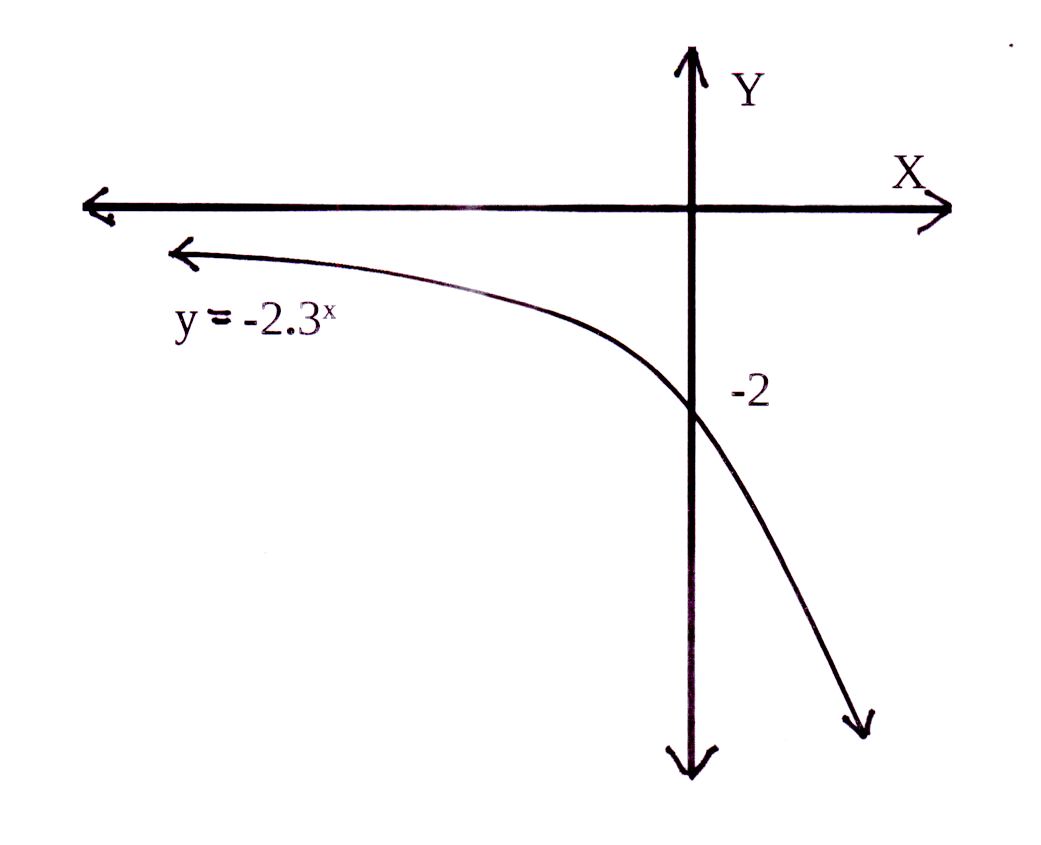
Die horisontale asimptoot : q = 0 en y = 0
The horizontal asymptote : q = 0 and y = 0
a = −2 en dus is die grafiek onderkant die horisontale
asimptoot, y = 0
a = −2 and therefore the graph is below the horizontal
asymptote, y = 0
3 > 1 en dus b > 1 maar a < 0 sodat die grafiek daal.
3 > 1 and thus b > 1 but a < 0 so that the graph
is decreasing.
Y-afsnit : y = −2 × 30 = −2 × 1 = −2
Y-afsnit is (0 ; −2)
Y-intercept : y = −2 × 30 = −2 × 1 = −2
Y-intercept is (0 ; −2)
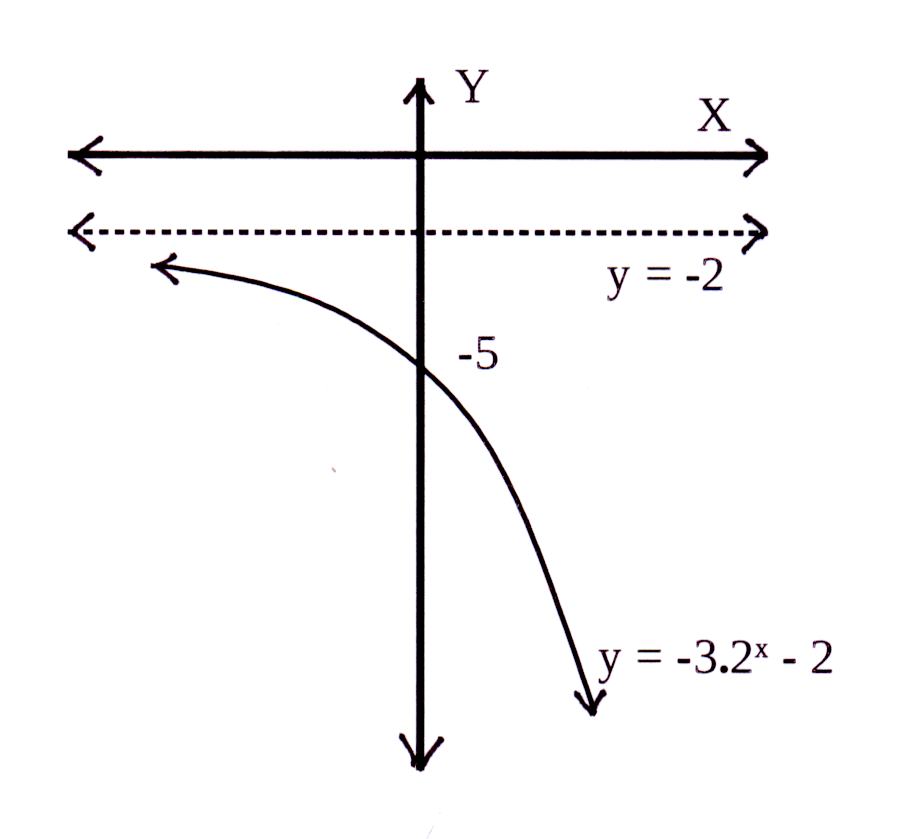
Die horisontale asimptoot : q = −2 en y = −2
The horizontal asymptote : q = −2 and y = −2
a = −3 en dus is die grafiek onderkant die horisontale
asimptoot, y = −2
a = −3 and therefore the graph is below the horizontal
asymptote, y = −2
2 > 1 en dus b > 1 maar a < 0 sodat die grafiek daal.
2 > 1 and thus b > 1 but a < 0 so that the graph
is decreasing.
Y-afsnit : y = −3 × 20 − 2 = −3 × 1 − 2 = −5
Y-afsnit is (0 ; −5)
Y-intercept : y = −3 × 20 − 2 = −3 × 1 − 2 = −5
Y-intercept is (0 ; −5)
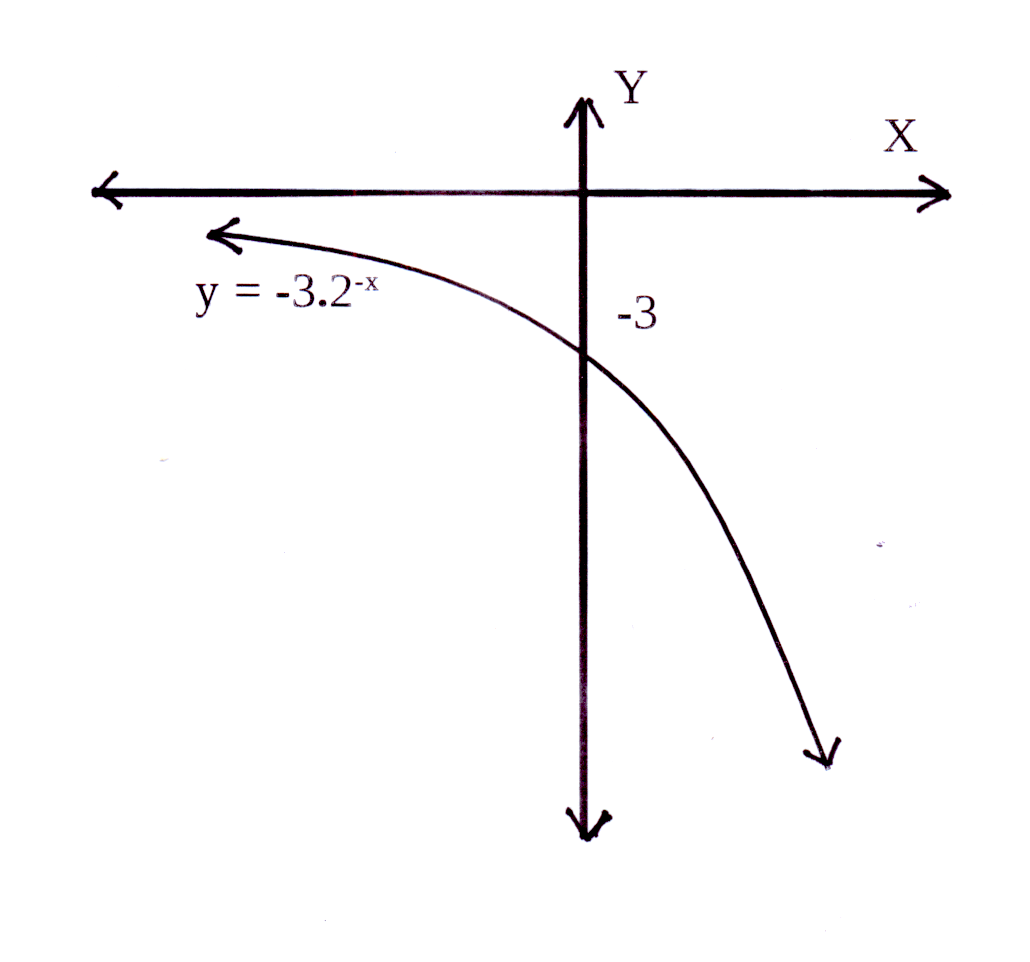
Die horisontale asimptoot : q = 0 en y = 0
The horizontal asymptote : q = 0 and y = 0
a = −3 en dus is die grafiek onderkant die horisontale
asimptoot, y = 0
a = −3 and therefore the graph is below the horizontal
asymptote, y = 0
2 > 1 en dus b > 1 maar a < 0 sodat die grafiek daal.
2 > 1 and thus b > 1 but a < 0 so that the graph
is decreasing.
Y-afsnit : y = −3 × 20 = −3 × 1 = −3
Y-afsnit is (0 ; −3)
Y-intercept : y = −3 × 20 = −3 × 1 = −3
Y-intercept is (0 ; −3)
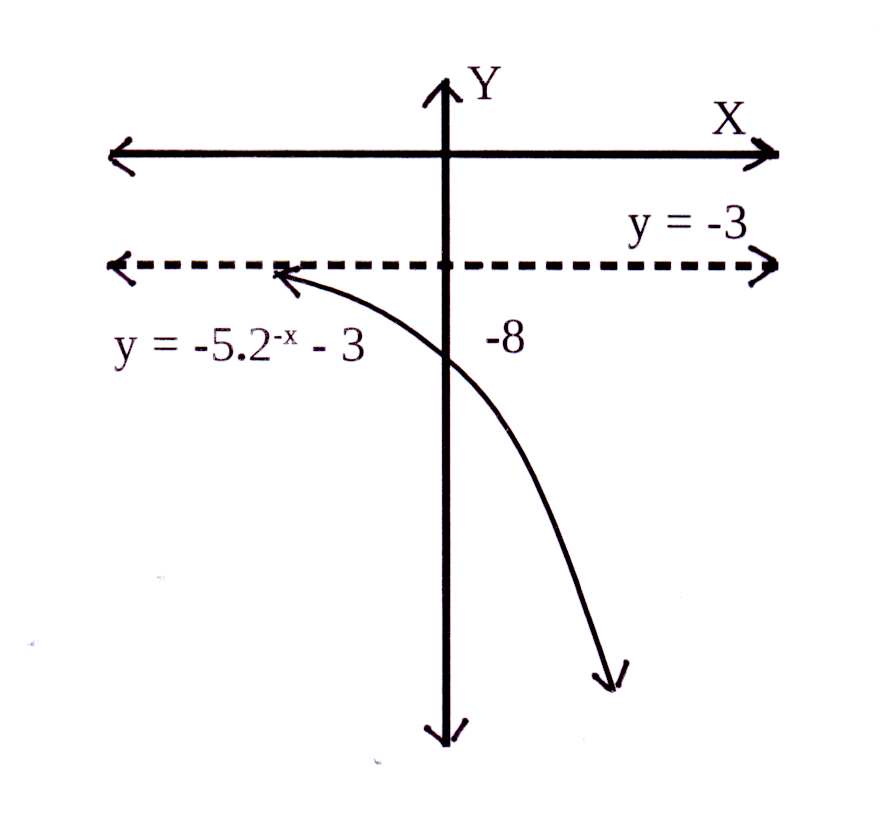
Die horisontale asimptoot : q = −3 en y = −3
The horizontal asymptote : q = −3 and y = −3
a = −5 en dus is die grafiek onderkant die horisontale
asimptoot, y = −3
a = −5 and therefore the graph is below the horizontal
asymptote, y = −3
2−1 < 1 en dus 0 < b < 1 maar a < 0 sodat die
grafiek styg.
2−1 < 1 and thus 0 < b < 1 but a < 0 so that the graph
is increasing.
Y-afsnit : y = −5 × 20 − 3 = −5 × 1 − 3 = −8
Y-afsnit is (0 ; −8)
Y-intercept : y = −5 × 20 − 3 = −5 × 1 − 3 = −8
Y-intercept is (0 ; −8)
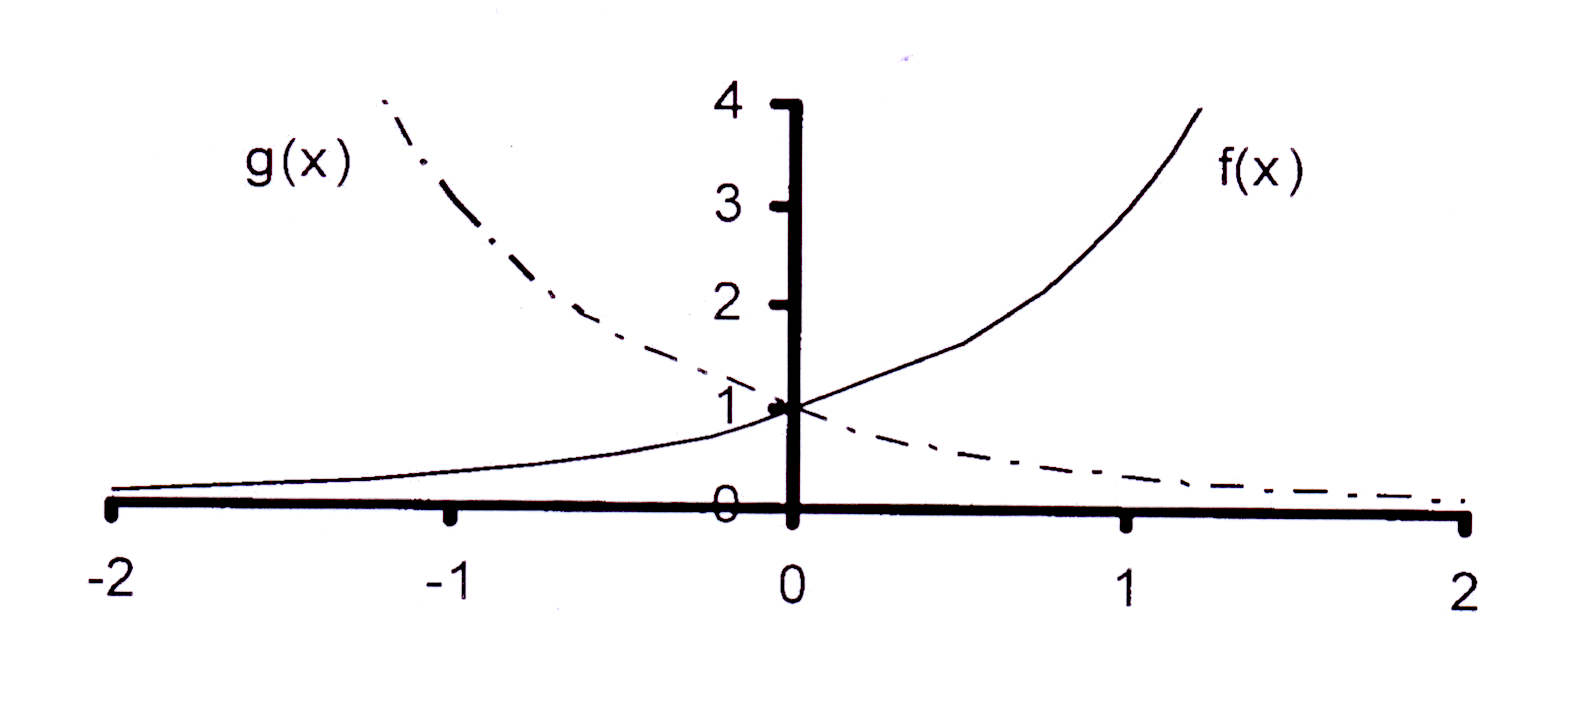
f(x) = 2x
Die horisontale asimptoot : q = 0 en dus y = 0
The horizontal asymptote : q = 0 and y = 0
a > 0 en dus is die grafiek bokant die horisontale
asimptoot, y = 0
a > 0 and therefore the graph is above the horizontal
asymptote, y = 0
2 > 1 en dus b > 1 en a > 0 sodat die
grafiek styg.
2 > 1 and thus b > 1 and a > 0 so that the graph
is increasing.
Y-afsnit : y = 20 = 1
Y-afsnit is (0 ; 1)
Y-intercept : y = 20 = 1
Y-intercept is (0 ; 1)
╭ 1 ╮x
g(x) = │ — │
╰ 2 ╯
Die horisontale asimptoot : q = 0 en dus y = 0
The horizontal asymptote : q = 0 and y = 0
a > 0 en dus is die grafiek bokant die horisontale
asimptoot, y = 0
a > 0 and therefore the graph is above the horizontal
asymptote, y = 0
2−1 < 1 en dus 0 < b < 1 maar a > 0 sodat die
grafiek daal.
2−1 < 1 and thus 0 < b < 1 but a > 0 so that the graph
is decreasing.
Y-afsnit : y = 20 = 1
Y-afsnit is (0 ; 1)
Y-intercept : y = 20 = 1
Y-intercept is (0 ; 1)
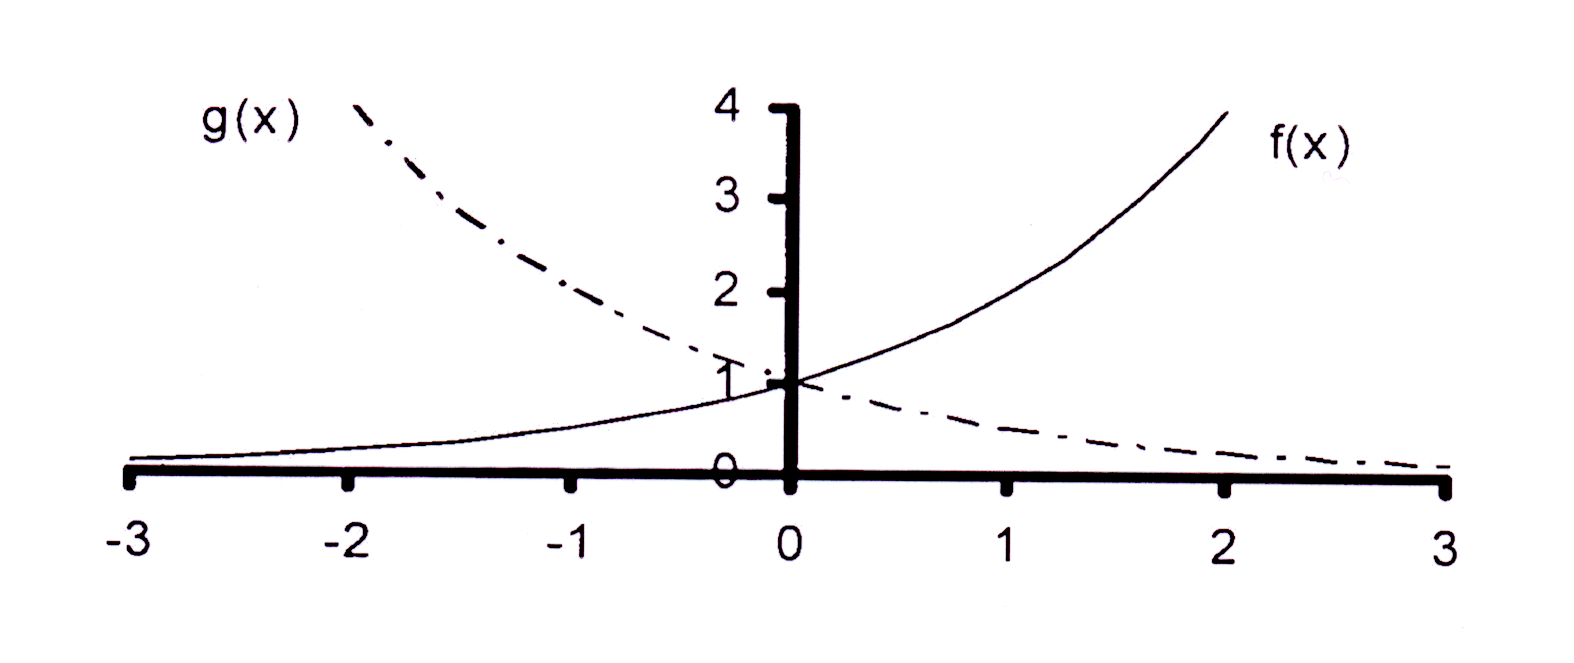
Let op dat g(x) die refleksie van f(x) in die Y-as is en dat f(x) die refleksie van g(x) in die Y-as is.
Note that g(x) is the reflection of f(x) in the Y-axis and that f(x) is the reflection of g(x) in the Y-axis.
f(x) = 3x
Die horisontale asimptoot : q = 0 en dus y = 0
The horizontal asymptote : q = 0 and y = 0
a > 0 en dus is die grafiek bokant die horisontale
asimptoot, y = 0
a > 0 and therefore the graph is above the horizontal
asymptote, y = 0
3 > 1 en dus b > 1 en a > 0 sodat die
grafiek styg.
3 > 1 and thus b > 1 and a > 0 so that the graph
is increasing.
Y-afsnit : y = 30 = 1
Y-afsnit is (0 ; 1)
Y-intercept : y = 30 = 1
Y-intercept is (0 ; 1)
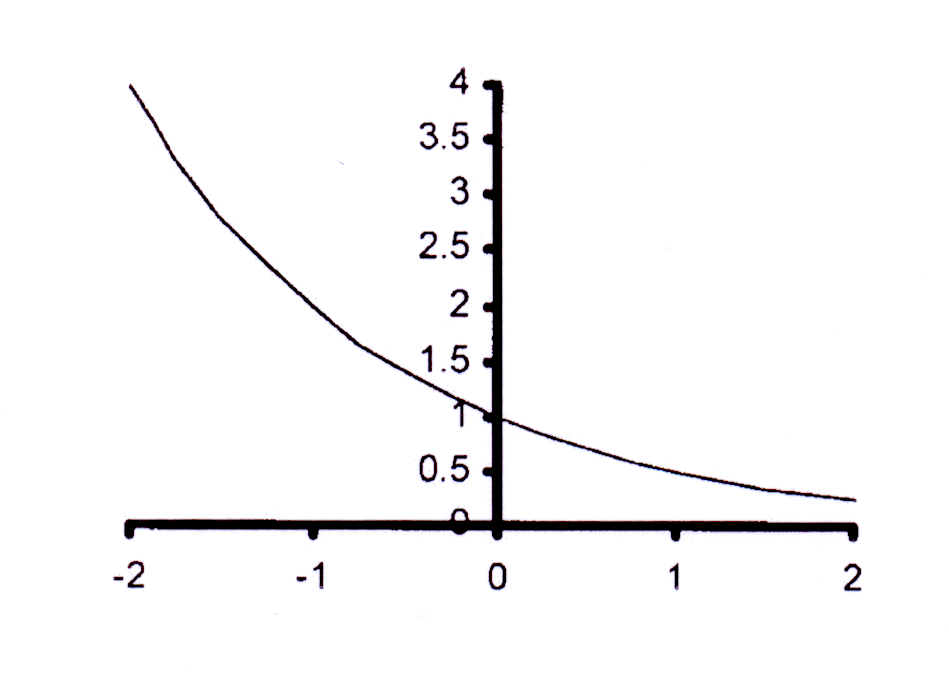
g(x) = 3−x
Die horisontale asimptoot : q = 0 en dus y = 0
The horizontal asymptote : q = 0 and y = 0
a > 0 en dus is die grafiek bokant die horisontale
asimptoot, y = 0
a > 0 and therefore the graph is above the horizontal
asymptote, y = 0
3−1 < 1 en dus 0 < b < 1 maar a > 0 sodat die
grafiek daal.
3−1 < 1 and thus 0 < b < 1 but a > 0 so that the graph
is decreasing.
Y-afsnit : y = 30 = 1
Y-afsnit is (0 ; 1)
Y-intercept : y = 30 = 1
Y-intercept is (0 ; 1)
Let op dat g(x) die refleksie van f(x) in die Y-as is en dat f(x) die refleksie van g(x) in die Y-as is.
Note that g(x) is the reflection of f(x) in the Y-axis and that f(x) is the reflection of g(x) in the Y-axis.
f(x) = 4x
Die horisontale asimptoot : q = 0 en dus y = 0
The horizontal asymptote : q = 0 and y = 0
a > 0 en dus is die grafiek bokant die horisontale
asimptoot, y = 0
a > 0 and therefore the graph is above the horizontal
asymptote, y = 0
4 > 1 en dus b > 1 en a > 0 sodat die
grafiek styg.
4 > 1 and thus b > 1 and a > 0 so that the graph
is increasing.
Y-afsnit : y = 40 = 1
Y-afsnit is (0 ; 1)
Y-intercept : y = 40 = 1
Y-intercept is (0 ; 1)
g(x) = −4x
Die horisontale asimptoot : q = 0 en dus y = 0
The horizontal asymptote : q = 0 and y = 0
a < 0 en dus is die grafiek onder die horisontale
asimptoot, y = 0
a < 0 and therefore the graph is below the horizontal
asymptote, y = 0
4 > 1 en dus b > 1 maar a < 0 sodat die
grafiek daal.
4 > 1 and thus b > 1 but a < 0 so that the graph
is decreasing.
Y-afsnit : y = −1 × 40 = −1 × 1 = −1
Y-afsnit is (0 ; −1)
Y-intercept : y = −1 × 40 = −1 × 1 = −1
Y-intercept is (0 ; −1)
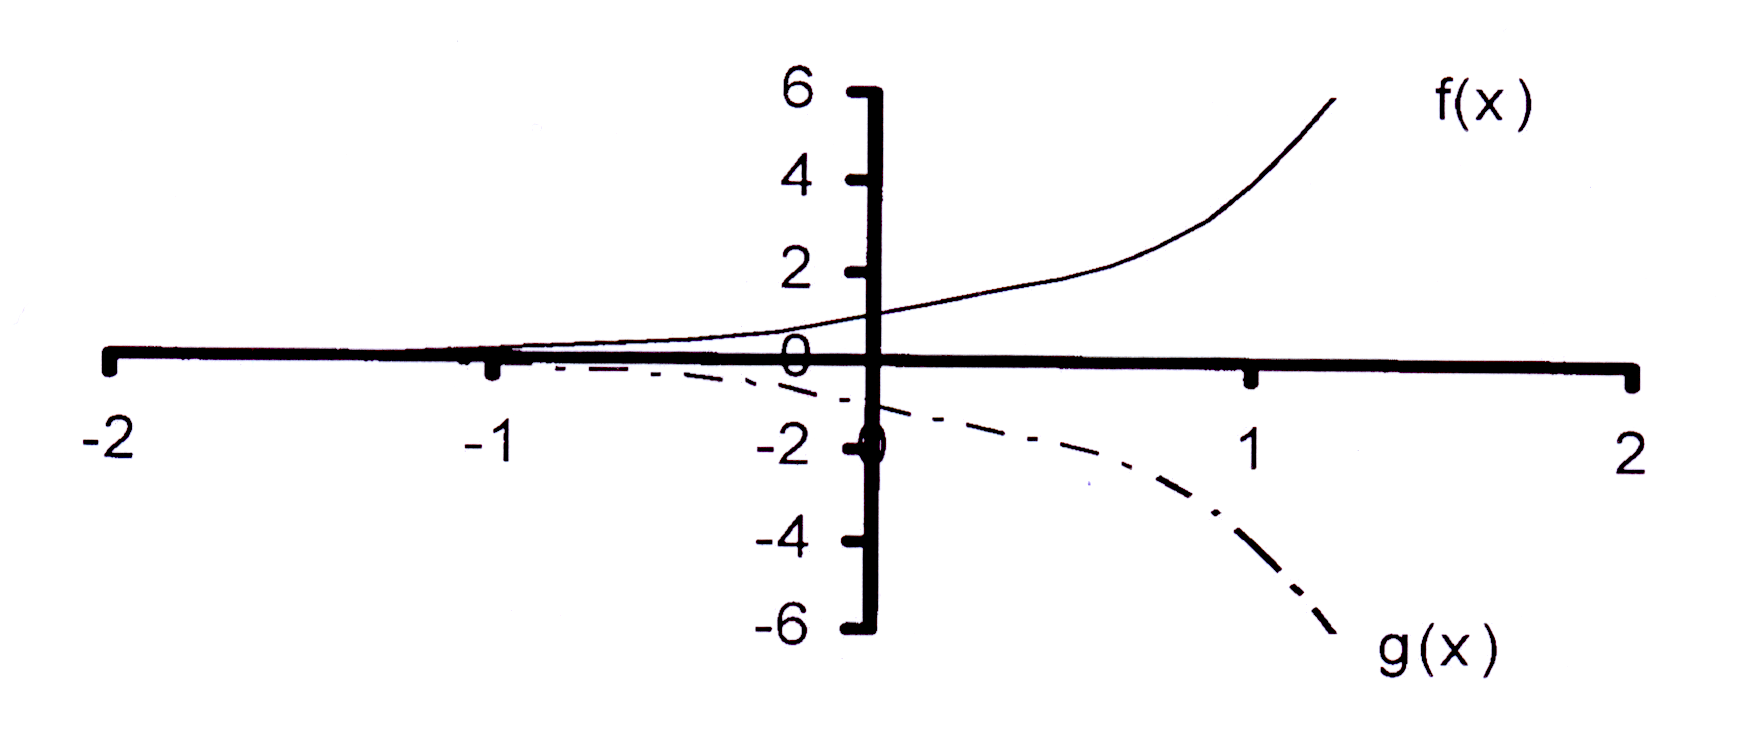
Let op dat g(x) die refleksie van f(x) in die X-as is en dat f(x) die refleksie van g(x) in die X-as is.
Note that g(x) is the reflection of f(x) in the X-axis and that f(x) is the reflection of g(x) in the X-axis.
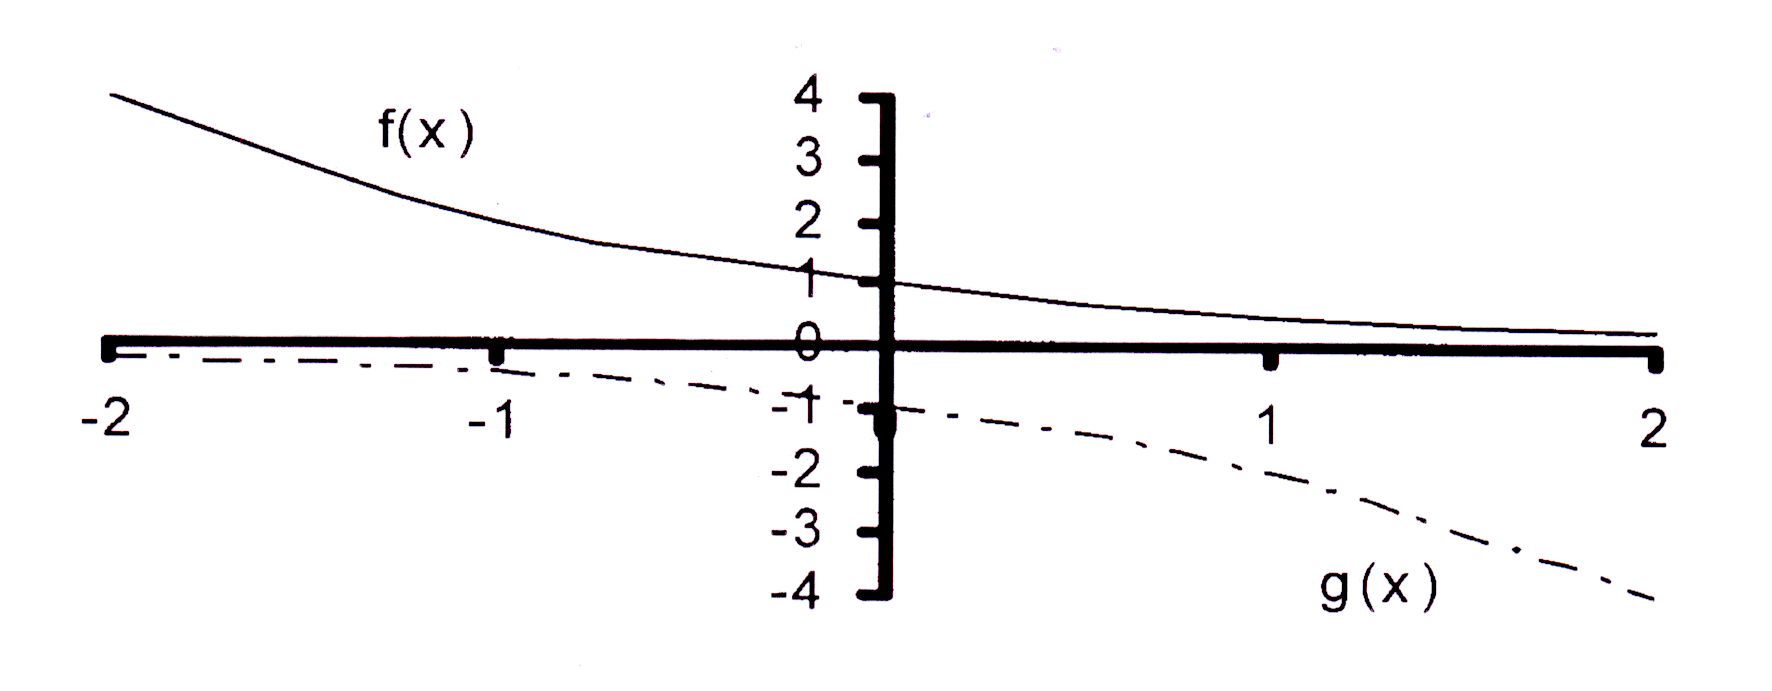
f(x) = 2 − x
Die horisontale asimptoot : q = 0 en dus y = 0
The horizontal asymptote : q = 0 and y = 0
a > 0 en dus is die grafiek bokant die horisontale
asimptoot, y = 0
a > 0 and therefore the graph is above the horizontal
asymptote, y = 0
2−1 < 1 en dus 0 < b < 1 en a > 0 sodat die
grafiek daal.
2−1 < 1 and thus 0 < b < 1 and a > 0 so that the graph
is decreasing.
Y-afsnit : y = 20 = 1
Y-afsnit is (0 ; 1)
Y-intercept : y = 20 = 1
Y-intercept is (0 ; 1)
g(x) = − 2x
Die horisontale asimptoot : q = 0 en dus y = 0
The horizontal asymptote : q = 0 and y = 0
a < 0 en dus is die grafiek onder die horisontale
asimptoot, y = 0
a < 0 and therefore the graph is below the horizontal
asymptote, y = 0
2 > 1 en dus b > 1 maar a < 0 sodat die
grafiek daal.
2 > 1 and thus b > 1 but a < 0 so that the graph
is decreasing.
Y-afsnit : y = −1 × 20 = −1 × 1 = −1
Y-afsnit is (0 ; −1)
Y-intercept : y = −1 × 20 = −1 × 1 = −1
Y-intercept is (0 ; −1)
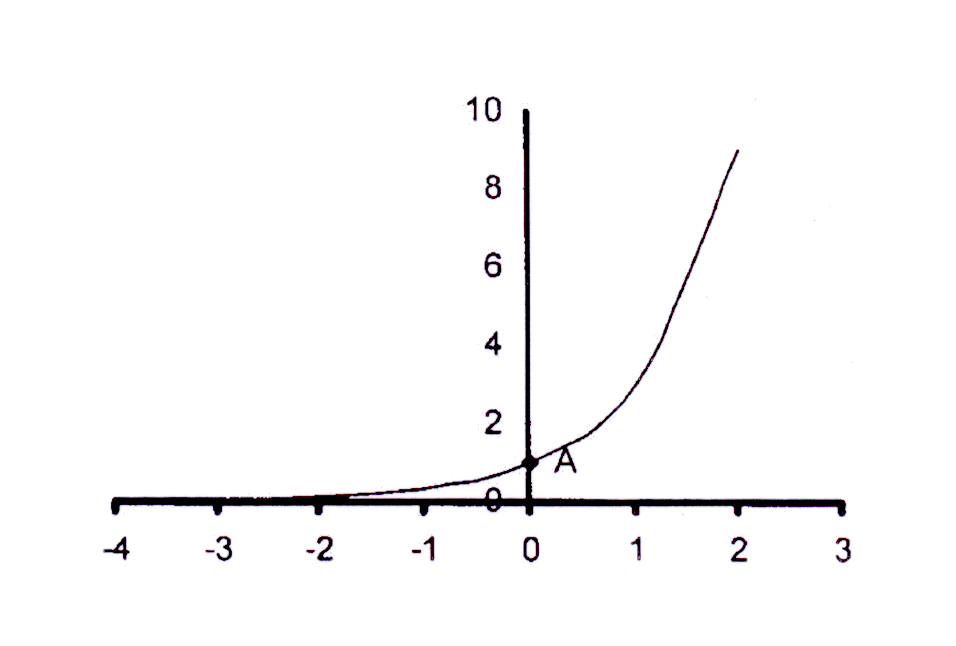
3.1 Y-afsnit / Y-intercept : y = 30 = 1
Y-afsnit / Yintercept is (0 ; 1) en / and A is (0 ; 1)
3.3 h(x) word 2 eenhede na onder geskuif
sodat y = − 2 en dus is q = − 2
h(x) is moved 2 units downwards so that
y = − 2 and thus q = − 2
Vergelyking / Equation : h(x) = 3x − 2
3.2 p(p;9) : 9 = 3p
32 = 3p
2 = p
3.4 Refleksie in die X-as |
| (x ; y) ⇾ (x ; −y)
Reflection in the X-axis |
sodat / so that y = 3x ⇾ −y = 3x
of beter / or more acceptable y = −3x
3.5 Refleksie in die Y-as |
| (x ; y) ⇾ (−x ; y)
Reflection in the Y-axis |
sodat / so that y = 3x ⇾ y = 3 − x
╭ 1 ╮x
of / or : y = │ — │
╰ 3 ╯
| (x ; y) ⇾ (−x ; y)
Reflection in the Y-axis |
sodat / so that y = 3x ⇾ y = 3 − x
╭ 1 ╮x
of / or : y = │ — │
╰ 3 ╯
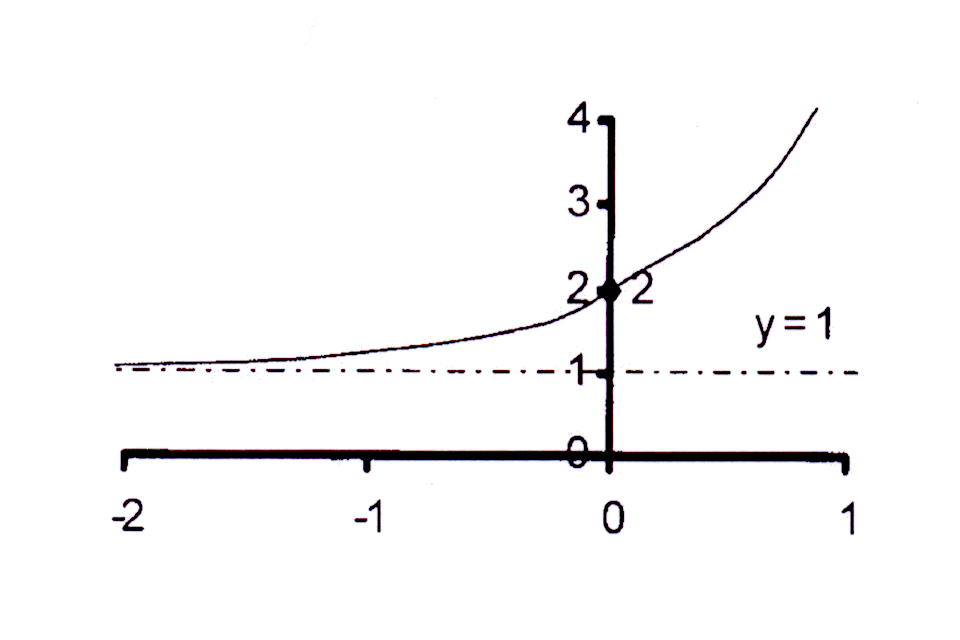
4.1 Horisontale asimptoot / Horizontal asymptote :
y = 1 en dus / so that q = 1
4.3 Y-afsnit / Y-intercept : y = 20 + 1 = 1 + 1
= 2
Y-afsnit / Yintercept is (0 ; 2) en / and A is (0 ; 2)
y = 1 en dus / so that q = 1
4.3 Y-afsnit / Y-intercept : y = 20 + 1 = 1 + 1
= 2
Y-afsnit / Yintercept is (0 ; 2) en / and A is (0 ; 2)
4.2 P(−1;1,5) : 1,5 = b−1 + 1
0,5 = b−1
2−1 = b−1
2 = b
Vergelyking / Equation : g(x) = 2x + 1
4.4 Q(t;5) : 5 = 2t + 1
4 = 2t
2 = t
0,5 = b−1
2−1 = b−1
2 = b
Vergelyking / Equation : g(x) = 2x + 1
4.4 Q(t;5) : 5 = 2t + 1
4 = 2t
2 = t
4.5 g(x) word 2 eenhede na onder geskuif
sodat y → y + 2
h(x) is moved 2 units downwards so that
y → y + 2
Vergelyking / Equation : y + 2 = 2x + 1
y = 2x − 1
h(x) = 2x − 1
sodat y → y + 2
h(x) is moved 2 units downwards so that
y → y + 2
Vergelyking / Equation : y + 2 = 2x + 1
y = 2x − 1
h(x) = 2x − 1
4.6 Refleksie in die Y-as |
| (x ; y) ⇾ (−x ; y)
Reflection in the Y-axis |
sodat / so that y = 2x + 1 ⇾ y = 2 − x + 1
╭ 1 ╮x
of / or : p(x) = ┃ — │ + 1
╰ 2 ╯
| (x ; y) ⇾ (−x ; y)
Reflection in the Y-axis |
sodat / so that y = 2x + 1 ⇾ y = 2 − x + 1
╭ 1 ╮x
of / or : p(x) = ┃ — │ + 1
╰ 2 ╯
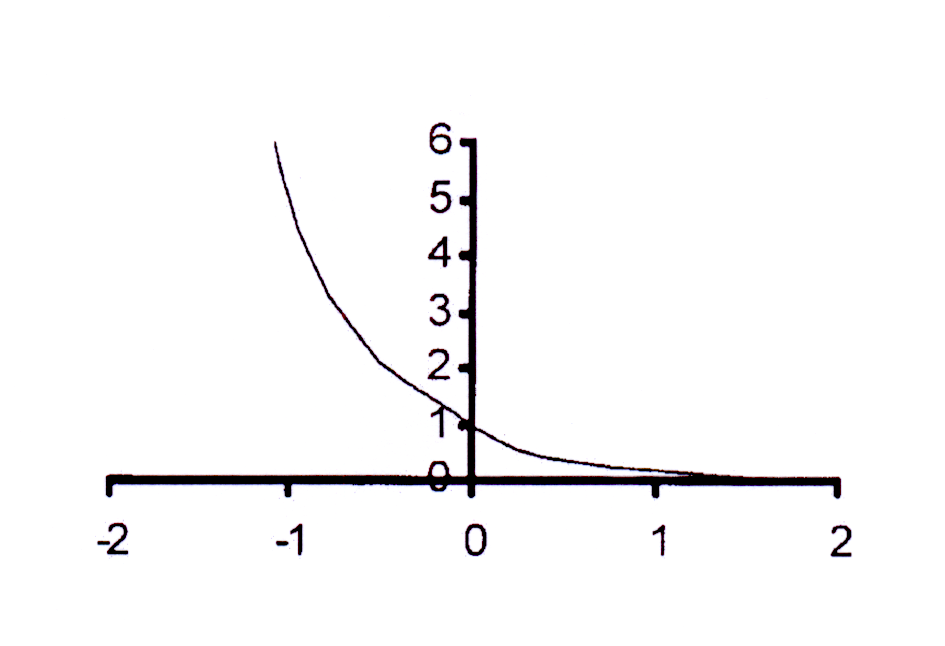
5.1 By / At P(−2;16) : 16 = b−2
42 = b−2
(4−1)−2 = b−2
4−1 = b
f(x) = (4−1)x
f(x) = 4−x
5.3 By / At Q(0,5;t) : t = 4−0,5 = (22)−0,5
t = 2−1 = 0,5
5.5 Refleksie in die Y-as : (x ; y) → (−x ; y)
Reflection in Y-axis : (x ; y) → (−x ; y)
y = 4−x → y = 4−(−x)
y = 4x
p(x) = 4x
42 = b−2
(4−1)−2 = b−2
4−1 = b
f(x) = (4−1)x
f(x) = 4−x
5.3 By / At Q(0,5;t) : t = 4−0,5 = (22)−0,5
t = 2−1 = 0,5
5.5 Refleksie in die Y-as : (x ; y) → (−x ; y)
Reflection in Y-axis : (x ; y) → (−x ; y)
y = 4−x → y = 4−(−x)
y = 4x
p(x) = 4x
5.2 By / At A : y = 40
y = 1
Y-afsnit / Y-intercept is (0 ; 1)
5.4 f(x) skuif 3 eenhede opwaarts sodat y → y − 3
f(x) is translated 3 units upwards so that y→ y − 3
y − 3 = 4−x
y = 4−x + 3
h(x) = 4−x + 3
5.6 Refleksie in die X-as : (x ; y) → (x ; −y)
Reflection in X-axis : (x ; y) → (x ; −y)
y = 4−x → −y = 4−x
y = − 4−x
r(x) = − 4−x
6.1 By / At A(0;−1) : −1 = a.b0
−1 = a.1
−1 = a
By / At P(−2;−16) : −16 = − b−2
− 42 = − b−2
(4−1)−2 = b−2
4−1 = b
f(x) = − (4−1)x
f(x) = − 4−x
6.3 f(x) skuif 2 eenhede opwaarts sodat y → y − 2
f(x) is translated 3 units upwards so that y→ y − 2
y − 2 = − 4−x
y = − 4−x + 2
h(x) = − 4−x + 2
6.5 Refleksie in die X-as : (x ; y) → (x ; −y)
Reflection in X-axis : (x ; y) → (x ; −y)
y = − 4−x → −y = − 4−x
y = 4−x
p(x) = 4−x
6.2 By / At Q(t;−0,5) : −0,5 = − 4−t
2−1 = (22)−t
2−1 = 2−2t
−1 = −2t
0,5 = t
6.4 Definisieversameling / Domain : {x | x ∈ ℜ }
Waardeversameling / Range : {y | y < 0 ; y ∈ ℜ }
6.6 Refleksie in die Y-as : (x ; y) → (−x ; y)
Reflection in Y-axis : (x ; y) → (−x ; y)
y = − 4−x → y = − 4−(−x)
y = − 4;x
r(x) = − 4x
2−1 = (22)−t
2−1 = 2−2t
−1 = −2t
0,5 = t
6.4 Definisieversameling / Domain : {x | x ∈ ℜ }
Waardeversameling / Range : {y | y < 0 ; y ∈ ℜ }
6.6 Refleksie in die Y-as : (x ; y) → (−x ; y)
Reflection in Y-axis : (x ; y) → (−x ; y)
y = − 4−x → y = − 4−(−x)
y = − 4;x
r(x) = − 4x
7.1 Horisonale asimptoot /
Horizontal asymptote : y = −2
q = −2
7.3 By / At A : y == 20 − 2 = −1
A is die punt / the point (0 ; −1)
7.5 By / At Q : t = 2−2 − 2
= ¼ − 2
= − 1¾
7.7 Waardeversameling / Range :
{ y | y > − 2; y ∈ ℜ }
Horizontal asymptote : y = −2
q = −2
7.3 By / At A : y == 20 − 2 = −1
A is die punt / the point (0 ; −1)
7.5 By / At Q : t = 2−2 − 2
= ¼ − 2
= − 1¾
7.7 Waardeversameling / Range :
{ y | y > − 2; y ∈ ℜ }
7.2 By / At P(−2 ; 2) : 2 = b−2 − 2
4 = b−2
(2−1)−2 = b−2
2−1 = b
f(x) = 2−x − 2
7.4 By / At B : 0 = 2−x − 2
21 = 2−x
1 = −x
−1 = x
B is die punt / the point (−1 ; 0)
7.6 f(x) skuif 2 eenhede opwaarts sodat y → y − 2
f(x) is translated 3 units upwards so that y → y − 2
y = 2−x − 2 → y −2 = 2−x − 2
y = 2−x − 2 + 2
y = 2−x
h(x) = 2−x
4 = b−2
(2−1)−2 = b−2
2−1 = b
f(x) = 2−x − 2
7.4 By / At B : 0 = 2−x − 2
21 = 2−x
1 = −x
−1 = x
B is die punt / the point (−1 ; 0)
7.6 f(x) skuif 2 eenhede opwaarts sodat y → y − 2
f(x) is translated 3 units upwards so that y → y − 2
y = 2−x − 2 → y −2 = 2−x − 2
y = 2−x − 2 + 2
y = 2−x
h(x) = 2−x
8.1 Horisonale asimptoot /
Horizontal asymptote : y = 3
q = 3
8.3 By / At B : r = − 21,585 + 3
= 0
Dus / Thus B(1,585;0) is die X-afsnit / the Xintercept.
Horizontal asymptote : y = 3
q = 3
8.3 By / At B : r = − 21,585 + 3
= 0
Dus / Thus B(1,585;0) is die X-afsnit / the Xintercept.
8.2 By / At A(0 ; 2) : 2 = a . b0 + 3
−1 = a . 1
−1 = a
By / At P(−1 ; 2,5) : 2,5 = −1 . b−1 + 3
−0,5 = −1 . b−1
0,5 = b−1
2−1 = b−1
2 = b
f(x) = − 2x + 3
8.4 Definisieversameling / Domain :
{ x | x ∈ ℜ }
Waardeversameling / Range :
{ y | y < 3 ; y ∈ ℜ }
−1 = a . 1
−1 = a
By / At P(−1 ; 2,5) : 2,5 = −1 . b−1 + 3
−0,5 = −1 . b−1
0,5 = b−1
2−1 = b−1
2 = b
f(x) = − 2x + 3
8.4 Definisieversameling / Domain :
{ x | x ∈ ℜ }
Waardeversameling / Range :
{ y | y < 3 ; y ∈ ℜ }
9.1 Horisonale asimptoot /
Horizontal asymptote : y = 3
q = 3
9.3 By / At B : r = − 2−(−1,585) + 3
= (−3) + 3 = 0
Dus / Thus B(−1,585;0) is die X-afsnit / the Xintercept.
9.5 Definisieversameling / Domain :
{ x | x ∈ ℜ }
Waardeversameling / Range :
{ y | y < 3 ; y ∈ ℜ }
Horizontal asymptote : y = 3
q = 3
9.3 By / At B : r = − 2−(−1,585) + 3
= (−3) + 3 = 0
Dus / Thus B(−1,585;0) is die X-afsnit / the Xintercept.
9.5 Definisieversameling / Domain :
{ x | x ∈ ℜ }
Waardeversameling / Range :
{ y | y < 3 ; y ∈ ℜ }
9.2 By / At A(0 ; 2) : 2 = a . b0 + 3
−1 = a . 1
−1 = a
By / At P(−1 ; 1) : 1 = −1 . b−1 + 3
−2 = − b−1
2 = b−1
2−1 = (b−1)−1
2−1 = b
f(x) = − 2−x + 3
9.4 By / At Q : 2,75 = − 2−t + 3
− 0,25 = −2−t
0,25 = 2−t
2−2 = 2−t
2 = t
−1 = a . 1
−1 = a
By / At P(−1 ; 1) : 1 = −1 . b−1 + 3
−2 = − b−1
2 = b−1
2−1 = (b−1)−1
2−1 = b
f(x) = − 2−x + 3
9.4 By / At Q : 2,75 = − 2−t + 3
− 0,25 = −2−t
0,25 = 2−t
2−2 = 2−t
2 = t