WISKUNDE
GRAAD 12
NOG OEFENINGE
Statistiek : antwoorde.
MATHEMATICS
GRADE 12
MORE EXERCISES
Statistics : answers.
Σx
195
1.1.1
Gemiddelde / Average = ─── = ─── = 9,75
n
30
1.1.2
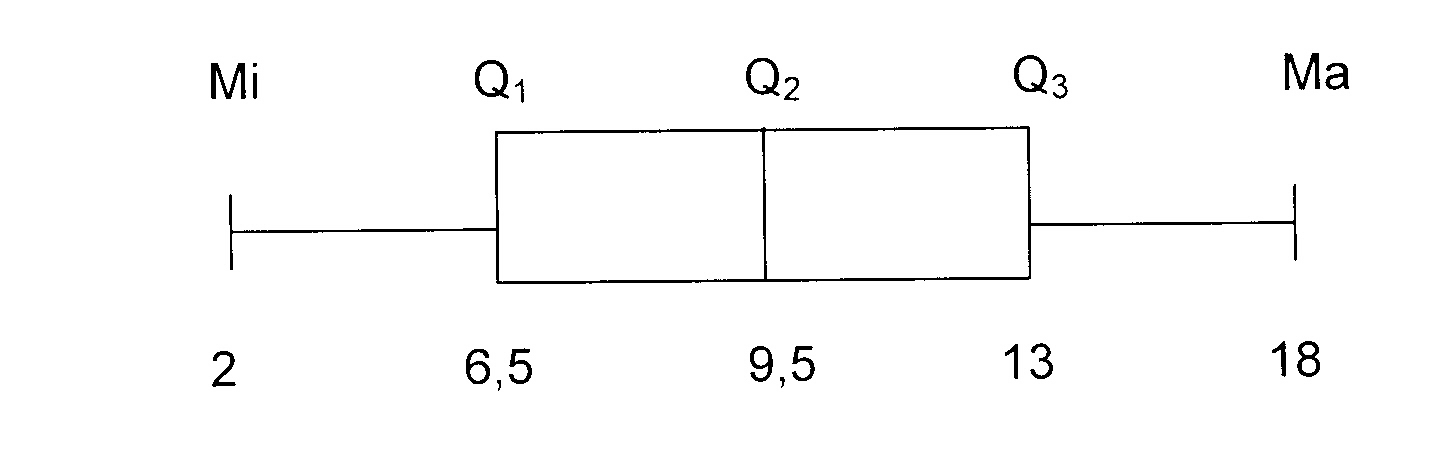
Rangskik / Arrange : 2; 3; 3; 5; 6; 7; 7; 7; 8; 9; 10; 11; 13; 13; 13; 13; 15; 16; 16; 18
(n + 1)
21
Pos. Q1 = ───── = ─── = 5,25
Q1 = 6 + 0,25 x (7 - 6) = 6,25
4
4
2(n + 1)
42
Pos. Q2 = ───── = ─── = 10,5
Q2 = 9 + 0,5 x (10 - 9) = 9,5
4
4
3(n + 1)
63
Pos. Q2 = ───── = ─── = 15,75
Q2 = 13 + 0,75 x (13 - 13) = 13
4
4
IKV / IQR = Q3 − Q1 = 13 − 6,5 = 6,5
1.1.3
Modus / Mode = 13 (f = 4)
1.1.4
Standaardafwyking / Standard deviation = 4,77 (rekenaar / calculator)
1.2
1.3
Nee. Die gemiddelde is ongeveer gelyk aan die mediaan.
1.3
No. The average is appoximately equal to the median.
1.4
gemiddelde / average - 1σ = 9,75 − 4,65 = 5,1 d.w.s. / i.e. 6
gemiddelde / average + 1σ = 9,75 + 4,65 = 14,4 d.w.s. / i.e. 14
Daar is 12 punte tussen 5,1 en 14,4. There are 12 marke between 5,1 and 14,4.
1.5
Ja, 60% van die leerlinge se punte is binne een standaardafwyking.
Yes, 60% of the pupils' marks are within one standard deviation.
1.6
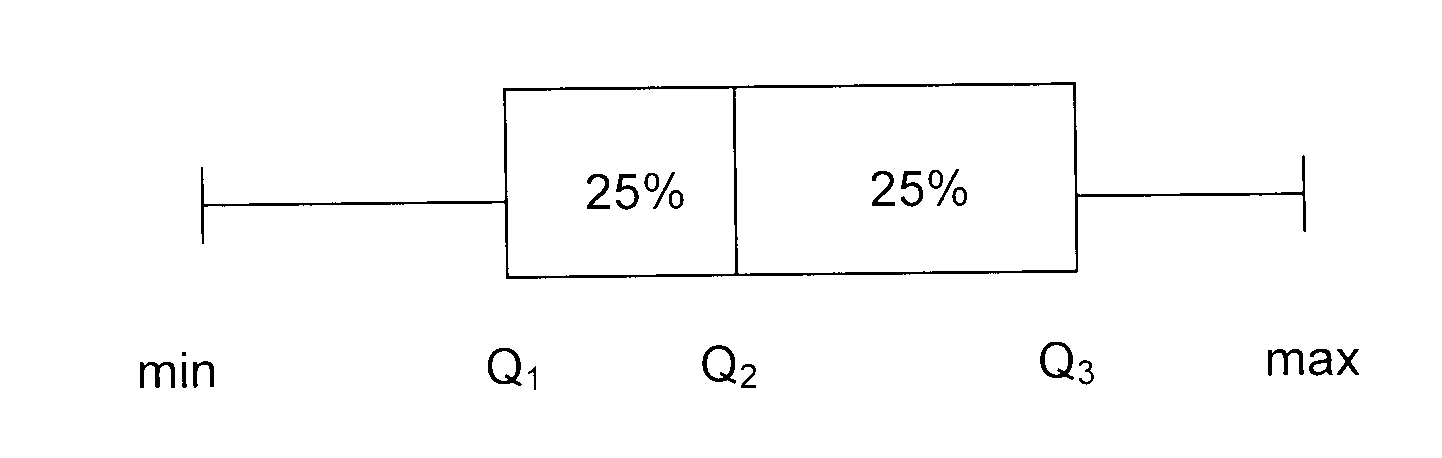
Die data is positief skeef of skeef na regs as die gemiddelde groter is as die mediaan.
1.6
The data is positively skewed or skewed to the right if the mean is greater than the median.
1.7
1.8
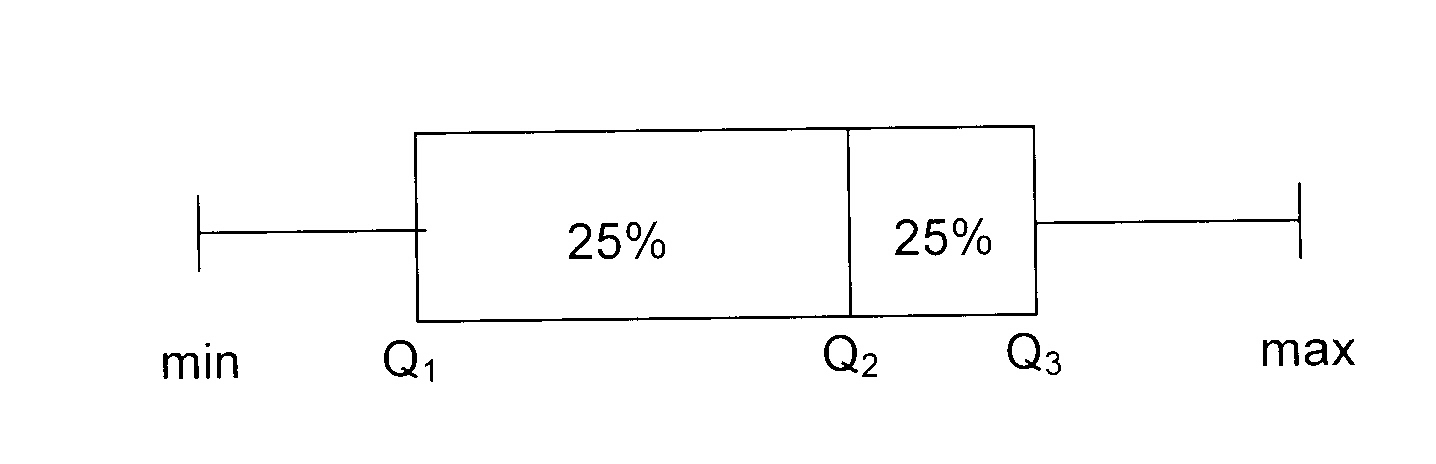
Die data is negatief skeef of skeef na links as die gemiddelde kleiner is as die mediaan.
1.8
The data is nagatively skewed or skewed to the left if the mean is smaller than the median.
1.9
2.
g = 54
g − a = 46 sodat / so that a = 8
d = 37
f = d + 10 = 37 + 10 = 47
b = f − 32 = 47 − 32 = 15
a + b + c + d + 2c + f + g = 7 × 32
3c = 224 − 161
c = 21
c = 21 en / and e = 42
g − a = 46 sodat / so that a = 8
d = 37
f = d + 10 = 37 + 10 = 47
b = f − 32 = 47 − 32 = 15
a + b + c + d + 2c + f + g = 7 × 32
3c = 224 − 161
c = 21
c = 21 en / and e = 42
3.
a = 22
g − a = 41 sodat / so that g = 63
d = 46
b = a + 6 = 22 + 6 = 28
f = b + 28 = 28 + 28 = 56
a + b + c + d + c + 10 + f + g = 7 × 43
2c = 301 − 215 − 10
c = 38
c = 38 en / and e = 48
4.1.1
gemiddelde / average = 174,63
4.1.2
Rangskik / Arrange :
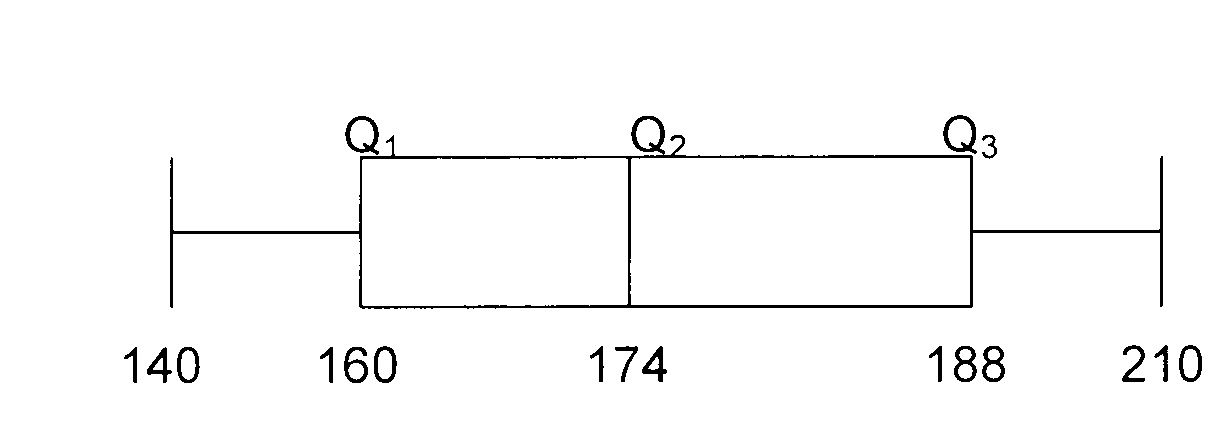
140; 151; 152; 153; 155; 160; 160; 160; 160; 166; 167; 172; 173; 173; 174;
174; 175; 175; 180; 184; 186; 188; 188; 188; 190; 192; 195; 198; 200; 210;
(n + 1)
31
Pos. Q1 = ───── = ─── = 7,75
Q1 = 160 + 0,75 x (160 - 160) = 160
4
4
2(n + 1)
62
Pos. Q2 = ───── = ─── = 15,5
Q2 = 174 + 0,5 x (174 - 174) = 174
4
4
3(n + 1)
93
Pos. Q3 = ───── = ─── = 23,25
Q3 = 188 + 0,25 x (188 - 188) = 188
4
4
IKV / IQR = Q3 − Q1 = 188 − 160 = 28
4.1.3
Modus / mode = 160
4.1.4
Standaardafwyking / Standard deviation = 16,63
4.2
4.3
Nee, die gemiddelde is feitlik gelyk aan
No, the average is practically equal to
die mediaan.
the median.
4.4
gemiddelde / average − σ = 174,63 − 16,63 = 158
gemiddelde / average + σ = 174,63 + 16,63 = 191,26
grense / boundaries is 158 en / and 191
20 leerlinge / pupils
4.5
Ja, 70% van die leerlinge se punt is binne een standaardafwyking van die gemiddelde.
Yes, 70% of the pupils have a mark within one standard deviation of the average.
5.1
A = 1,093; B = 0,048; vergelyking / equation : y = 1,093 + 0,048x
5.2
r = 0,99
5.3
Die bewering word gestaaf want die korrelasiekoëffisiënt = 0,99 wat op byna perfekte
positiewe lineêre verband dui.
The statement is verified by the data because the correlation coefficient = 0,99 which
shows a nearly perfect positive linear relationship.
5.4
5.5
4,44 l/100 km
115 km/h
6.1
A = 476,36; B = −8,56; vergelyking / equation : y = 476,36 − 8,56x
6.2
r = −0,99
6.3
Die bewering word gestaaf want die korrelasiekoëffisiënt = −0,99 wat op byna perfekte
negatiewe lineêre verband dui, d.w.s. hoe ouer die dame, hoe minder spandeer sy.
The statement is verified by the data because the correlation coefficient = −0,99 which
shows a nearly perfect negative linear relationship, i.e. the older the lady, the less
she spends.
6.4
6.5
R305,19
31,12 jaar / years
7.1
| |
| Massa m (kg)
Mass m (kg) |
Klas middelpunt x
Class midpoint |
Frekwensie f
Frequency |
Kum. frek.
Cum. freq. |
f . x |
| 50 < m ≤ 60 |
55 |
3 | 3 |
165 |
| 60 < m ≤ 70 |
65 |
7 | 10 |
455 |
| 70 < m ≤ 80 |
75 |
9 | 19 |
675 |
| 80 < m ≤ 90 |
85 |
7 | 26 |
595 |
| 90 < m ≤ 100 |
95 |
3 | 29 |
285 |
| 100 ≤ m ≤ 110 |
105 |
1 | 30 |
105 |
|
Σf.x
2 280
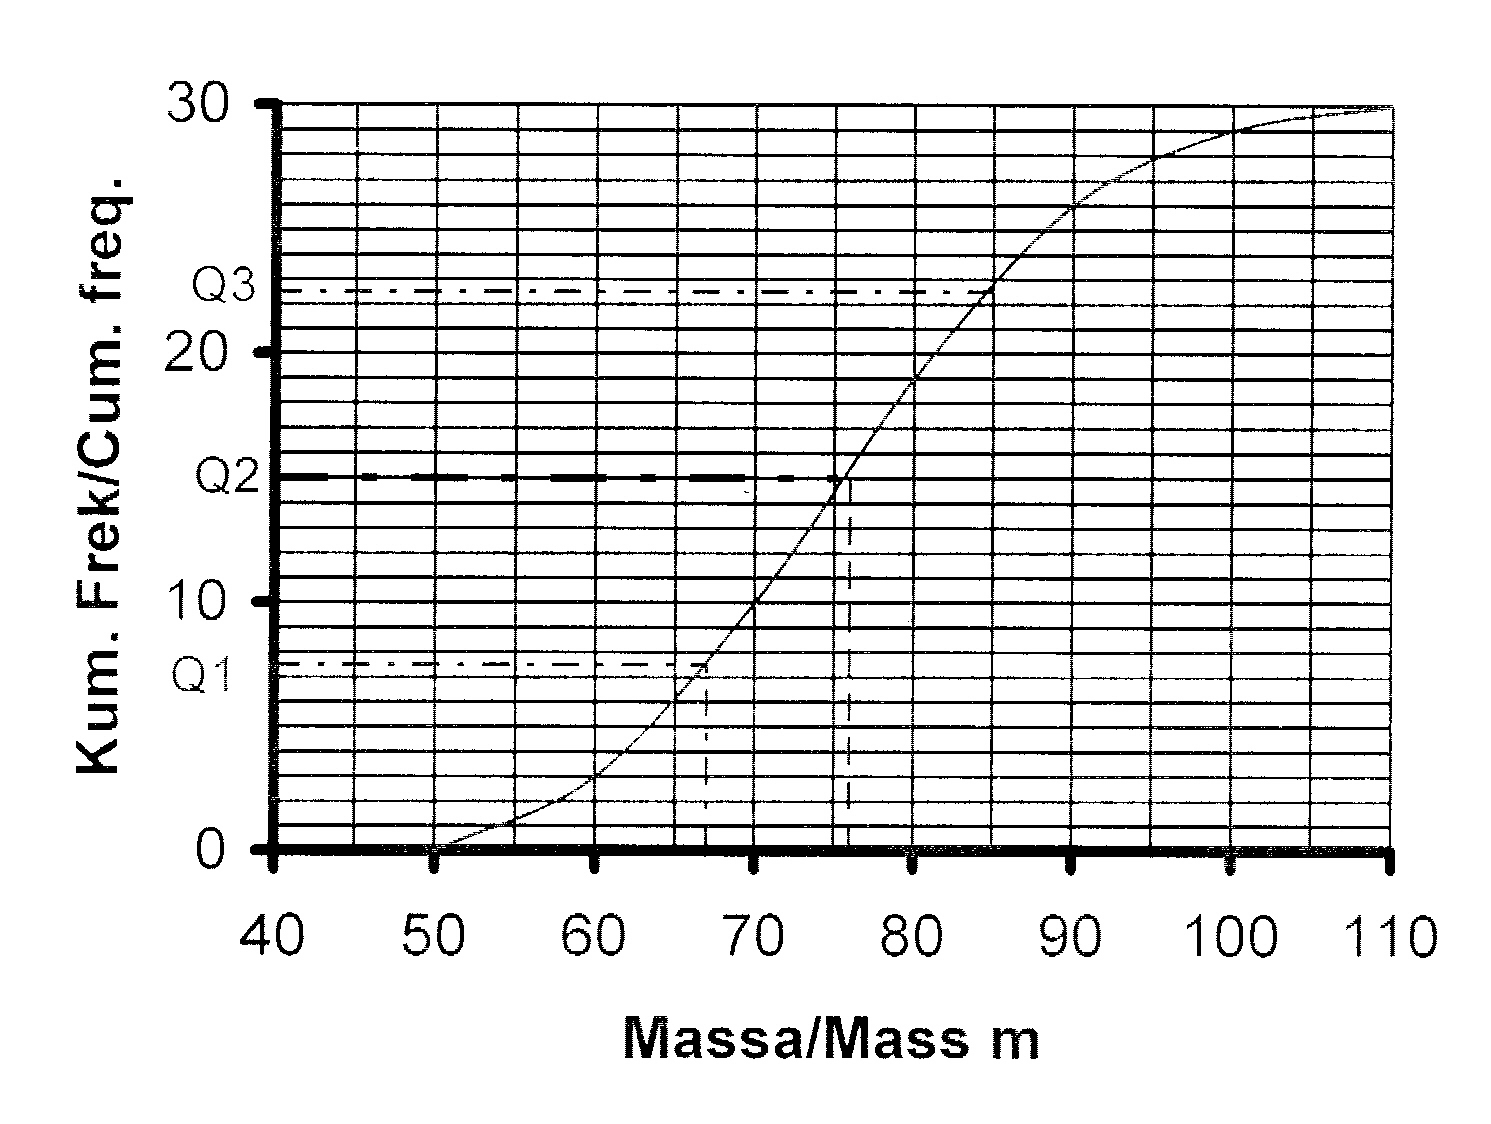
7.2
Gemiddelde / mean = ──── = ────── = 76
n
30
7.3
8.1
| |
| Punte
Marks |
Klas middelpunt
Class midpoint |
Frekwensie f
Frequency |
Kum. frek.
Cum. freq. |
f . x |
| 0 ≤ m ≤ 10 |
5 |
2 | 2 |
10 |
| 10 < m ≤ 20 |
15 |
3 | 5 |
45 |
| 20 < m ≤ 30 |
25 |
4 | 9 |
100 |
| 30 < m ≤ 40 |
35 |
5 | 14 |
175 |
| 40 < m ≤ 50 |
45 |
8 | 22 |
360 |
| 50 < m ≤ 60 |
55 |
8 | 30 |
440 |
| 60 < m ≤ 70 |
65 |
7 | 37 |
455 |
| 70 < m ≤ 80 |
75 |
6 | 43 |
450 |
| 80 < m ≤ 90 |
85 |
4 | 47 |
340 |
| 90 < m ≤ 100 |
95 |
3 | 50 |
285 |
|
Σf.x
2 660
8.2
Gemiddelde / mean = ──── = ────── = 53,2
n
50
8.3
Aantal / number < 40 = 14
8.4
Aantal / number 39 < n < 61 = 30 − 14 = 16
8.5
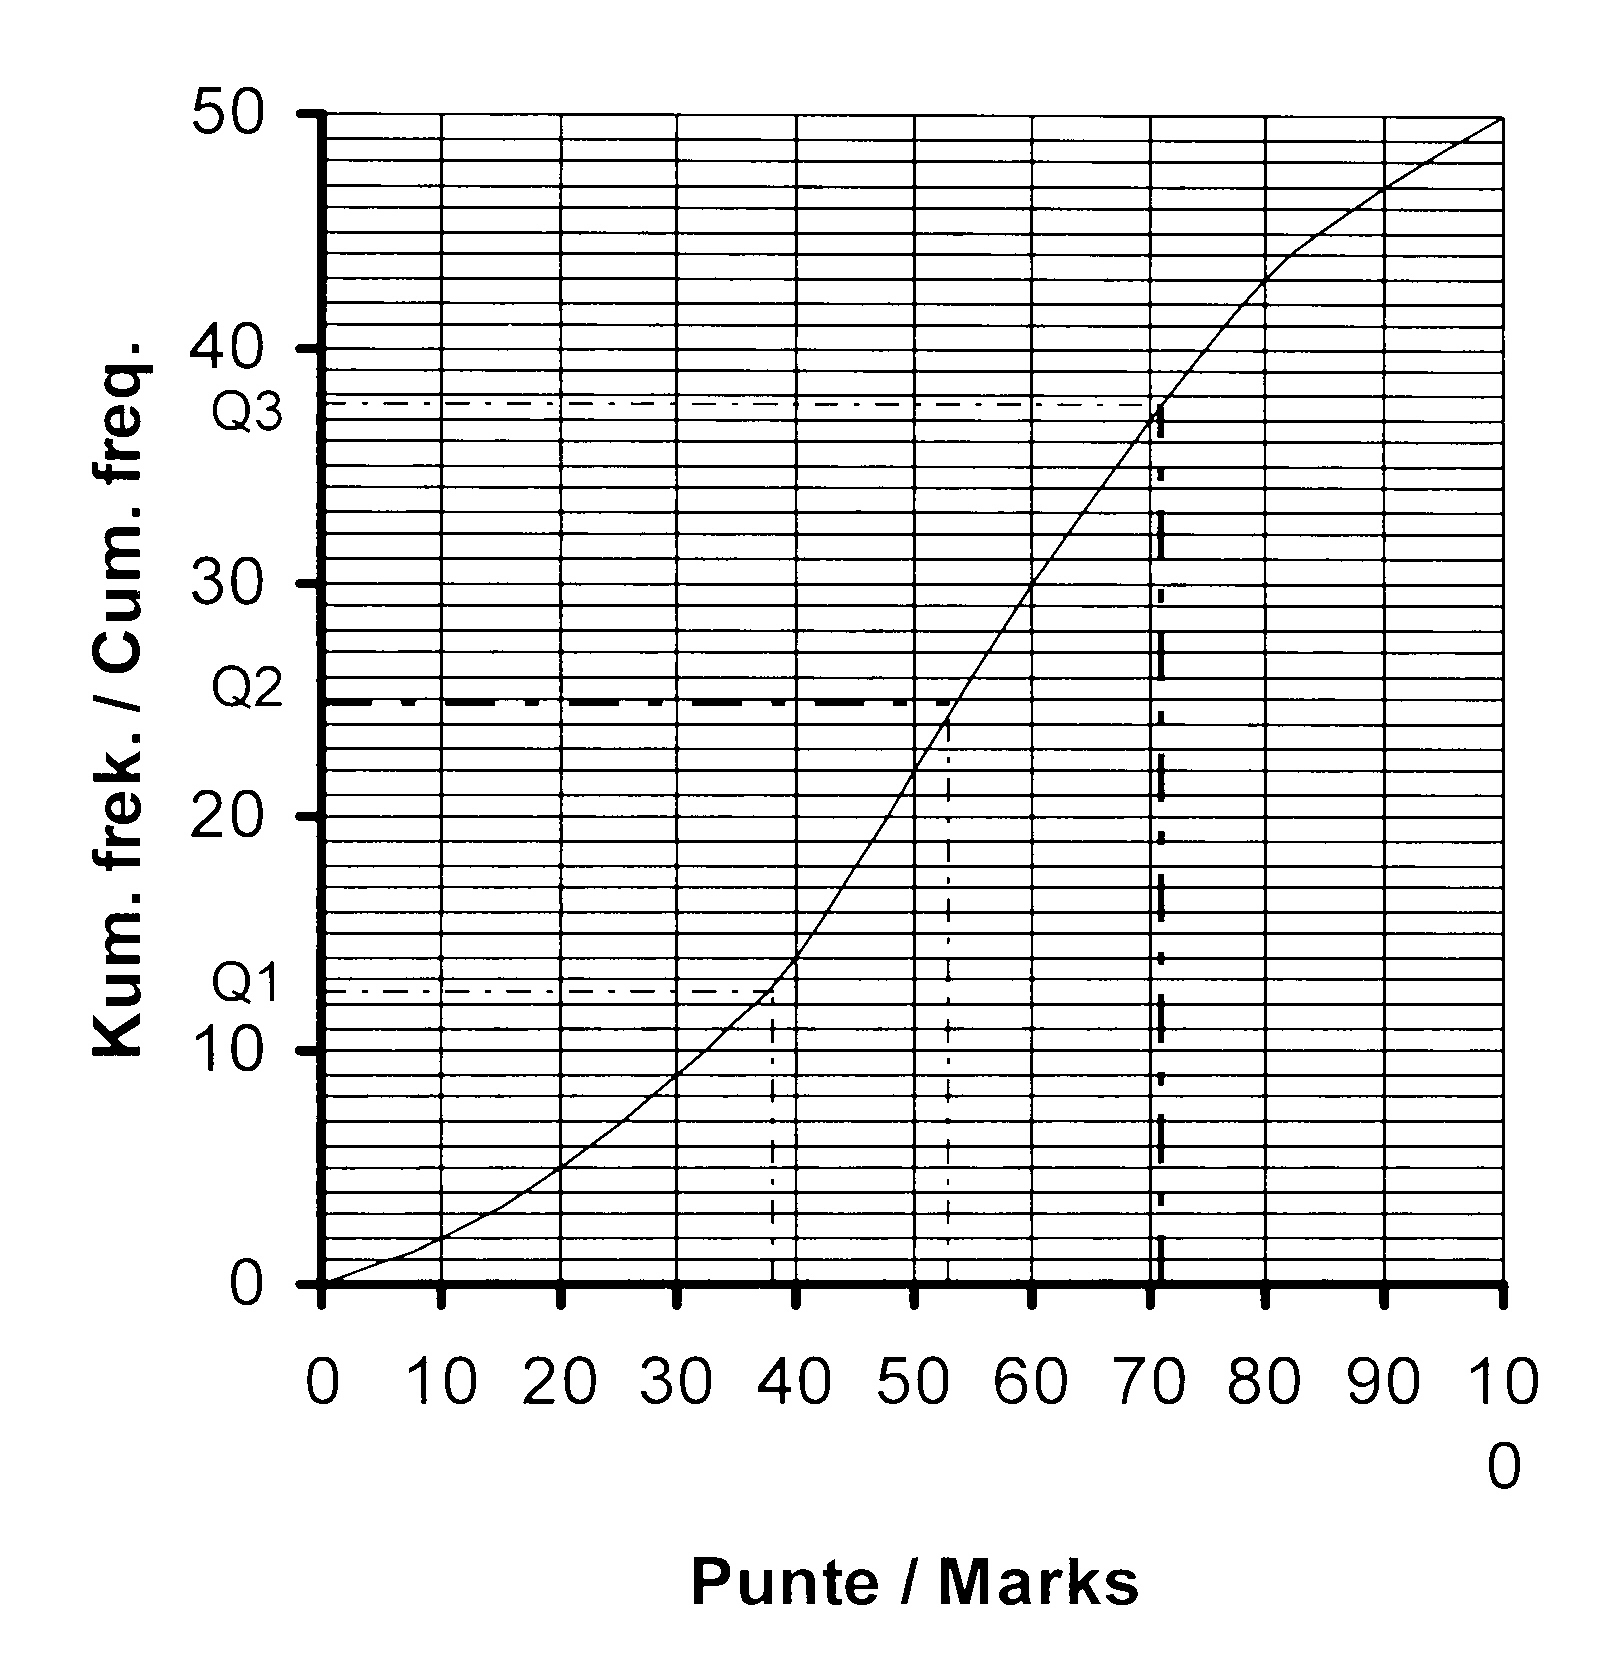
8.6
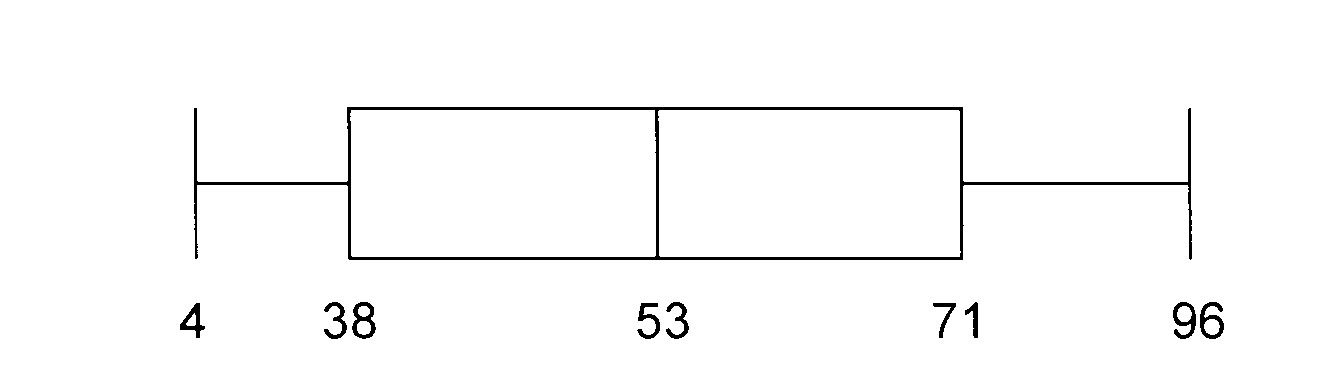
Q1 = 38
Q2 = 53
Q3 = 71
8.7
Maksimum punt = 38
Maximum mark = 38
8.8
Minimum punt = 71
Minimum mark = 71
8.9
9.1
Aantal leerlinge / Number of pupils = 168 − 68
9.2
Maksimum lengte / Maximum length = 164 cm
= 100
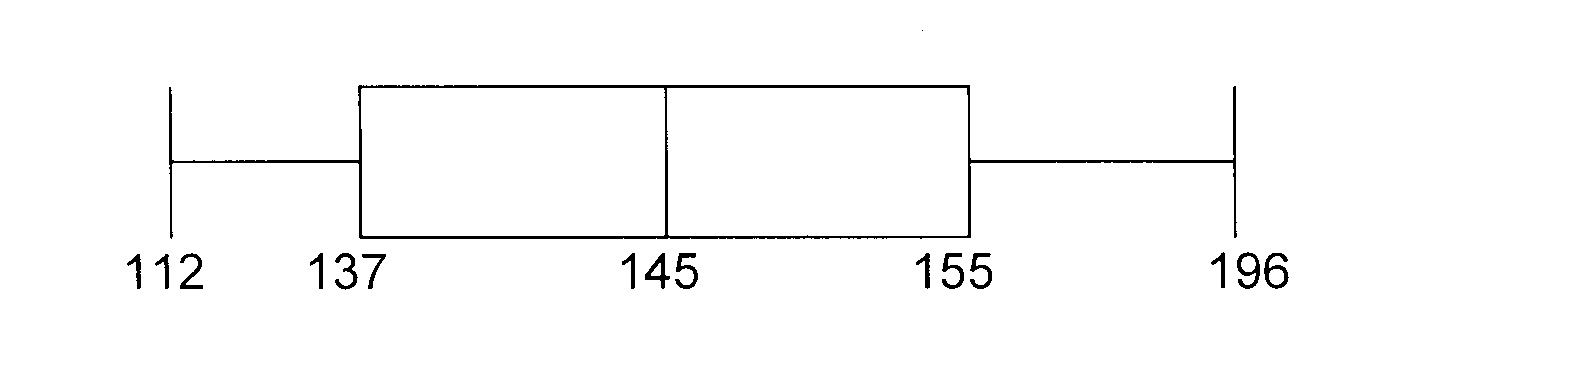
9.3
Deel aantal studente in 4 gelyke groepe. / Divide the number of stdents into 4 equal groups.
Lees die kwartiele by 50, 100 en 150 studente. / Read the quartiles at 50, 100 and 150 students.
Q1 = 137; Q2 = 145; en / and Q3 = 155
9.4
Maksimum lengte / Maximum length = 137 cm
9.5
Minimum lengte / Minimum length = 155 cm
9.6
10.1
50 studente / students.
10.2
40% van / of 50 studente / students = 20
Lees punte by / Read mark at kum. / cum. f = 20 Slaagpunt / Pass mark = 43
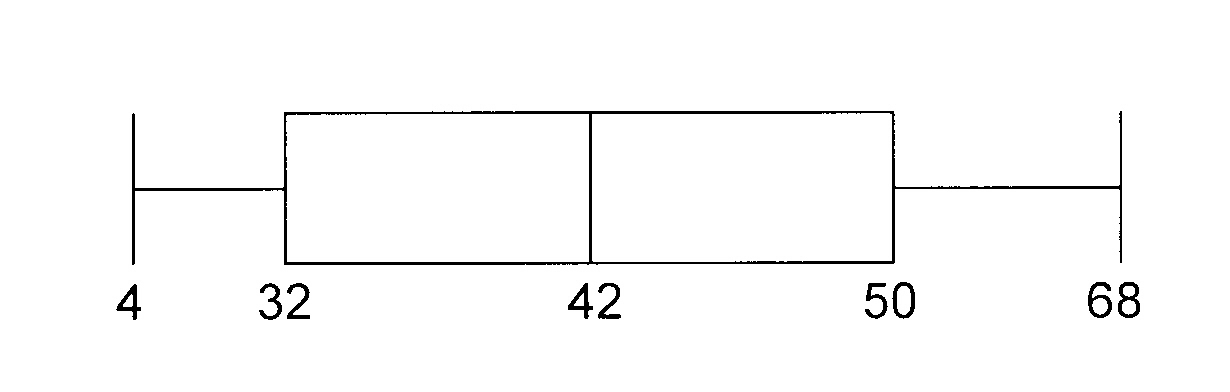
10.3
Verdeel in 4 gelyke dele. / Divide into 4 equal parts.
Lees / Read Q1 by / at 12,5 Q1 = 37
Lees / Read Q2 by / at 25 Q2 = 48
Lees / Read Q3 by / at 37,5 Q3 = 65
10.4
25% van die studente het 'n punt tussen 48 (Q2) en 65 (Q3).
25% of the students have a mark between 48 (Q2) and 65(Q3).
Aantal studente / Number of students = 12,5 d.i. / i. e. 12.
10.5
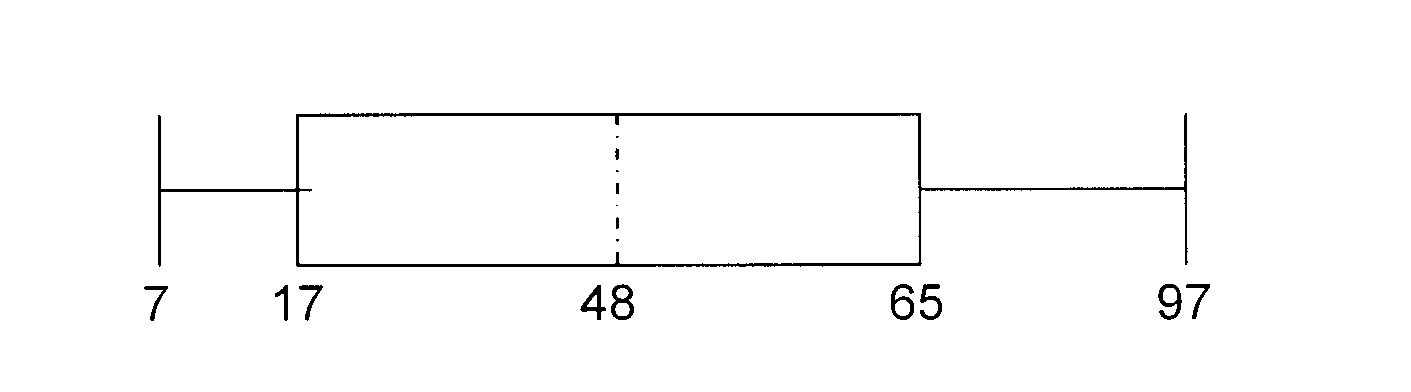
11.1
40 mense / shoppers.
11.2
Verdeel in 4 gelyke dele. / Divide into 4 equal parts.
Lees / Read Q1 by / at 10 Q1 = 32
Lees / Read Q2 by / at 20 Q2 = 42
Lees / Read Q3 by / at 30 Q3 = 50
11.3
Mediaan ouderdom / Median age = 42
11.4
12.1
A = − 158,66 en / and B = 0,35 sodat / so that y = − 158,66 + 0,35x
12.2
r = 0,98
12.3
Daar is 'n baie sterk positiewe verhouding tussen m en T sodat as die molêre massa groter
word, styg die kookpunt.
There is a very strong positive relationship between m and T, so that if the molar mass increases,
the boiling point also increases.
12.4
−158,66 °C
12.5
101,22 g.mol−1
13.1
Daar is 'n sterk positiewe verhouding tussen
13.1
There is a strong positive relationship between
x en y sodat as x groter word, word y in
x and y so that if x increases y will also
dieselfde mate groter.
increase in the same ratio.
13.2
y = 88,8
13.3
x = 19,6
14.1
Daar is 'n sterk negatiewe verhouding tussen
14.1
There is a strong negative relationship
x en y sodat as x groter word, word y in
between x and y so that if x increases
dieselfde mate kleiner.
y will decrease in the same ratio.
14.2
y = 44,5
14.3
x = 39,3