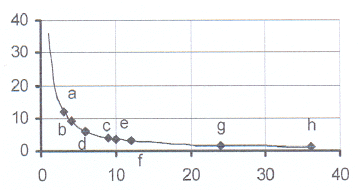
 1. The sketch shows the graph of xy = 16.
 Complete the following table:
x 1 a 4 c 12 16
y 16 8 b 3,2 d 1
1.1 Calculate the value of a, b, c and d in the table.
1.2 What happens to the value of y if x becomes greater?
1.3 Is y directly proportional to x? Explain.
1.4 Can x or y ever be equal to 0 in this graph? Explain.
1.5.1 What is the significance of the point (4 ; b)? Explain.
1.5.2 Calculate the equation of the straight line through the
origin and the point (4 ; b).
1.6 Consider the points M(64 ; m) and N(128 ; n). Calculate the values of m and n.
2. Consider the following table:
x 1 2 3 b 6 c 10 f 24 h
y 36 18 a 9 d 4 e 3 g 1
2.1 Write down the equation of the graph.
2.2 Calculate the values of a to h in the table.
2.3 Draw the graph on graph paper.
2.4 Show clearly on your graph where you will read the values of a to h on the graph.
2.5 The points M(144 ; m) and N(n ; 0,2) are points on the graph. Caculate the value of m and of n.
3. Study the following table:
x 1 2 4 8 0,5 32 e
y 8 a b c 16 d 64
3.1 Write down the equation of the graph.
3.2 Calculate the values of the letters in the table.
3.3 Are the points M(0,25 ; 16) and N(128 ; 0,0625) points on the graph? Explain your answer.
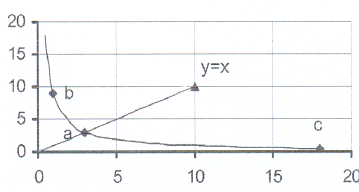
 4. The sketch shows the graph of xy = 9
 4.1 (1 ; b) and (c ; 18) are points on the graph.
Calculate the values of b and c.
4.2 The line y = x intersects the hyperbola in the
point (3 ; a).
4.2.1 Calculate the value of a.
4.2.2 What is the significance of the point (3 ; a)?
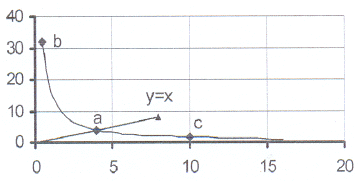
 5. The sketch shows the graph of xy = 16
 5.1 The points (b ; 32) and (10 ; c) are points on
the graph. Calculate the values of b and c.
5.2 The line y = x intersects the hyperbole in
the point (a ; 4).
5.2.1 Calculate the value of a.
5.2.2 What is the significance of the point (a ; 4)?
5.3 Explain how you can use the graph to find the value
of the square root of 16.
5.4 Explain how you can use the graph to find the value
of the square root of 64.
6. Sketch the graph of xy = 25 by completing the following table:
x 1 2 4 10 d e f
y 25 a b c 20 50 0,25
6.1 Draw a straight line on your graph that you can use to find the square root of 25.
Mark the point where you will read the value P.
6.2 Explain how you can use the graph to determine the square root of 100 and of 1.
6.3 A straight line passes through the points (d ; 20) and (e ; 50).
6.3.1 Calculate the equation of the line.
6.3.2 Calculate the coordinates of the intercepts of the line with the axses.
7. Given that xy = 24
7.1 The points A(2 ; a), B(b ; 8), C(c ; 6) and D(16 ; d) are points on the hyperbole.
Calculate the values of a, b, c and d.
7.2 What happens to the values of x if y becomes smaller?
7.3 For which value(s) of x is y = 0?
Explain your answer.
7.4 Explain how you can use the graph to determine the square root of 24.
7.5 Explain how you can use the graph to determine the square root of 96 and of 6.
8. A piece of rope is 8 m long. Pieces of equal length are cut off the rope.
8.1 Let x represent the number of pieces cut off from the rope and y the length of each piece.
Write down the relationship between x and y in words and in symbols.
Give a reason for your answer.
8.2 Complete the following table by calculating the value of each letter in the table:
Number of pieces cut off 1 2 b 8
Length of each piece 8 a 2 c
8.3 How many pieces of 0,8 m can be cut from the rope?
8.4 What is the length of 1 piece if 5 pieces are cut off the rope?
8.5 A graph is drawn with the number of pieces on the X-axis and the length of each piece on the Y-axis.
8.5.1 What shape will this graph have? Explain.
8.5.2 Draw this graph with number of pieces ranging from 1 to 8.
8.5.3 Use the letter A to show where on your graph you can read the answer to 8.3 and use the
letter B to show where on your graph you can read the answer to 8.4
8.5.4 Can the left arm of the graph be made longer, i.e. can the length of each piece be made longer?
Explain. What effect will this have on the number of pieces cut off the rope?
8.5.5 Can the right arm of the graph be made longer, i.e. can the number of pieces increase?
Explain. What effect will this have on the length of each piece?
9. You can cut 20 slices off a loaf of bread if the slices are 15 mm thick.
9.1 What is the length of the loaf of bread?
9.2 Write down a relationship in words and in symbols between the number of slices, x,
and the thicness of a slice, y.
9.3 Calculate the thicknes of each slice of bread if you cut
9.3.1 3 slices off the loaf.
9.3.2 8 slices off the loaf.
9.4 Calculate the number of slices of bread that you can cut off the loaf if each slice is
9.4.1 6 cm thick.
9.4.2 20 mm thick.
9.5.1 Draw a graph of number of slices on the X-axis and thickness of a slice on the Y-axis.
9.5.2 Use the letters A and B to show where you would read the answers to 9.3.1 (A) and 9.3.2 (B) on your graph.
9.5.3 Use the letters C and D to show where you would read the answers to 9.4.1 (C) and 9.4.2 (D) on your graph.
9.5.4 Can the left arm of the graph be made longer, i.e. can the thickness of each slice be made thicker?
Explain. What effect will this have on the number of slices cut off from the loaf?
9.5.5 Can the right arm of the graph be made longer, i.e. can the number of slices increase?
Explain. What effect will this have on the thickness of each piece?
9.6 What is the thickness of the thickest slice? Explain your answer.
9.7 What is the maximum number of slices that you can cut off the loaf? Explain.