WISKUNDE
GRAAD 12
NOG OEFENINGE
Funksies en grafieke van die derde graad.
GRAAD 12
NOG OEFENINGE
Funksies en grafieke van die derde graad.
MATHEMATICS
GRADE 12
MORE EXERCISES
Functions and graphs of the third degree.
GRADE 12
MORE EXERCISES
Functions and graphs of the third degree.
1. Gegee f(x) = x3 + 5x2 - 8x - 12.
1.1 Skryf die koördinate van f(x) se afsnit met
die Y-as neer.
1.2 Toon aan dat x + 1 'n faktor van f(x) is.
1.3 Bepaal die afsnitte van f(x) met die x-as.
1.4 Bepaal die koördinate van f(x) se draaipunte.
1.5 Skets die grafiek van f(x).
1.6 Vir watter waarde(s) van x is
1.6.1 f(x) > 0?
1.6.2 f(x) stygend?
1. Given f(x) = x3 + 5x2 - 8x - 12.
1.1 Write down the coordinates of the intercept of f(x)
with the Y-axis.
1.2 Show that x + 1 is a factor of f(x).
1.3 Determine the intercepts of f(x) with the x-axis.
1.4 Determine the coordinates of the turning points
of f(x).
1.5 Sketch the graph of f(x).
1.6 For which value(s) of x is f(x)
1.6.1 f(x) > 0?
1.6.2 f(x) increasing?
2. Gegee f(x) = x3 − 3x2 + 4.
2.1 Bereken die koördinate van f(x) se afsnitte met
die asse.
2.2 Bepaal die koördinate van f(x) se draaipunte.
2.3 Skets die grafiek van f(x).
2.4 Vir watter waarde(s) van x is
2.4.1 f(x) > 0?
2.4.2 f(x) dalend?
2.1 Bereken die koördinate van f(x) se afsnitte met
die asse.
2.2 Bepaal die koördinate van f(x) se draaipunte.
2.3 Skets die grafiek van f(x).
2.4 Vir watter waarde(s) van x is
2.4.1 f(x) > 0?
2.4.2 f(x) dalend?
2. Given f(x) = x3 − 3x2 + 4.
2.1 Calculate the coordinates of the intercept of f(x)
with the axes.
2.2 Determine the coordinates of the turning points
of f(x).
2.3 Sketch the graph of f(x).
2.4 For which value(s) of x is f(x)
2.4.1 f(x) > 0?
2.4.2 f(x) decreasing?
2.1 Calculate the coordinates of the intercept of f(x)
with the axes.
2.2 Determine the coordinates of the turning points
of f(x).
2.3 Sketch the graph of f(x).
2.4 For which value(s) of x is f(x)
2.4.1 f(x) > 0?
2.4.2 f(x) decreasing?
3. Gegee f(x) = −x3 + x2 + 5x + 3.
3.1 Bereken die koördinate van f(x) se afsnitte met
die asse.
3.2 Bepaal die koördinate van f(x) se draaipunte.
3.3 Skets die grafiek van f(x).
3.4 Vir watter waarde(s) van x is
3.4.1 f(x) <> 0?
3.4.2 f(x) stygend?
3.4.3 f'(x) > 0?
3.1 Bereken die koördinate van f(x) se afsnitte met
die asse.
3.2 Bepaal die koördinate van f(x) se draaipunte.
3.3 Skets die grafiek van f(x).
3.4 Vir watter waarde(s) van x is
3.4.1 f(x) <> 0?
3.4.2 f(x) stygend?
3.4.3 f'(x) > 0?
3. Given f(x) = −x3 + x2 + 5x + 3.
3.1 Calculate the coordinates of the intercept of f(x)
with the axes.
3.2 Determine the coordinates of the turning points
of f(x).
3.3 Sketch the graph of f(x).
3.4 For which value(s) of x is f(x)
3.4.1 f(x) <> 0?
3.4.2 f(x) increasing?
3.4.3 f'(x) > 0?
3.1 Calculate the coordinates of the intercept of f(x)
with the axes.
3.2 Determine the coordinates of the turning points
of f(x).
3.3 Sketch the graph of f(x).
3.4 For which value(s) of x is f(x)
3.4.1 f(x) <> 0?
3.4.2 f(x) increasing?
3.4.3 f'(x) > 0?
4. Gegee f(x) = −x3 + x2 + 9x − 9.
4.1 Bereken die koördinate van f(x) se afsnitte met
die asse.
4.2 Bepaal die koördinate van f(x) se draaipunte.
4.3 Skets die grafiek van f(x).
4.4 Bepaal die koördinate van f(x) se buigpunt.
4.5 Vir watter waarde(s) van x is
4.5.1 f(x) ≥ 0?
4.5.2 f(x) dalend?
4.5.3 f'(x) > 0?
4.5.4 f(x) konkaaf na bo?
4. Given f(x) = −x3 + x2 + 9x − 9.
4.1 Calculate the coordinates of the intercept of f(x)
with the axes.
4.2 Determine the coordinates of the turning points
of f(x).
4.3 Sketch the graph of f(x).
4.4 Determine the coordinates of the point
of inflection.
4.4 For which value(s) of x is f(x)
4.4.1 f(x) ≥ 0?
4.4.2 f(x) decreasing?
4.4.3 f'(x) > 0?
4.5.4 f(x) concave to the top?
5. Die skets hieronder toon die grafiek van
f(x) = x3 + 3x2 − 13x − 15.
f(x) = x3 + 3x2 − 13x − 15.
5. The diagram below shows the graph of
f(x) = x3 + 3x2 − 13x − 15.
f(x) = x3 + 3x2 − 13x − 15.
5.1 Bereken die koördinate van punte A, B, C en D.
5.2 Bepaal die koördinate punte P en Q , f(x)
se draaipunte.
5.3 Vir watter waarde(s) van x is
5.3.1 f(x) > 0?
5.3.2 f(x) dalend?
5.3.3 f'(x) > 0?
5.4 Beskryf f(x) = 0 se wortels.
5.5 g(x) is die grafiek wat gevorm word as f(x)
25 eenhede na bo geskuif word.
Beskryf g(x) = 0 se wortels.
5.1 Calculate the coordinates of points A, B, C and D.
5.2 Determine the coordinates of points P and Q the
turning points of f(x).
5.3 For which value(s) of x is
5.3.1 f(x) > 0?
5.3.2 f(x) decreasing?
5.3.3 f'(x) > 0?
5.4 Describe the roots of f(x) = 0.
5.5 g(x) is the graph that is formed when f(x) is shifted
25 units upwards. Describe the roots of g(x) = 0.
6. Die skets hieronder toon die grafiek van
f(x) = x3 + 2x2 − 11x − 12.
f(x) = x3 + 2x2 − 11x − 12.
6. The diagram below shows the graph of
f(x) = x3 + 2x2 − 11x − 12.
f(x) = x3 + 2x2 − 11x − 12.
6.1 Bereken die koördinate van punte A, B, C en D.
6.2 Bepaal die koördinate punte P en Q , f(x)
se draaipunte.
6.3 Vir watter waarde(s) van x is
6.3.1 f(x) < 0?
6.3.2 f(x) stygend?
6.3.3 f'(x) > 0?
6.3.4 f(x) konkaaf na onder?
6.4 Beskryf f(x) = 0 se wortels.
6.5 g(x) is die grafiek wat gevorm word as f(x)
12,6 eenhede na onder geskuif word.
Beskryf g(x) = 0 se wortels.
6.1 Calculate the coordinates of points A, B, C and D.
6.2 Determine the coordinates of points P and Q the
turning points of f(x).
6.3 For which value(s) of x is
6.3.1 f(x) < 0?
6.3.2 f(x) increasing?
6.3.3 f'(x) > 0?
6.3.4 concave to the bottom?
6.4 Describe the roots of f(x) = 0.
6.5 g(x) is the graph that is formed when f(x) is shifted
12,6 units downwards. Describe the roots
of g(x) = 0.
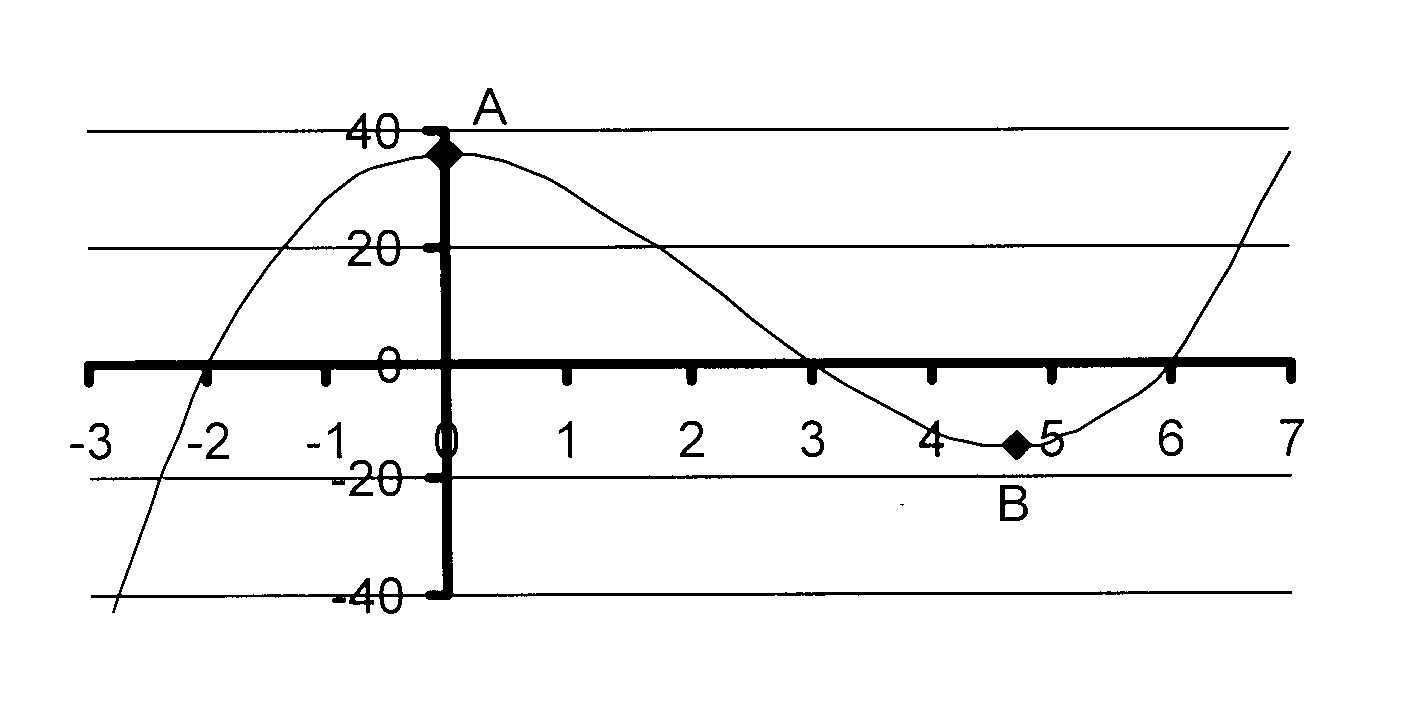
7. Die skets hieronder toon die grafiek van
f(x) = ax3 + bx2 + cx + d.
Die Y-afsnit is (0 ; 36).
7.1 Bereken die waardes van a, b, c en d
en dus die vergelyking van f(x).
7.2 Bepaal die koördinate punt B, 'n
draaipunt van f(x).
f(x) = ax3 + bx2 + cx + d.
Die Y-afsnit is (0 ; 36).
7.1 Bereken die waardes van a, b, c en d
en dus die vergelyking van f(x).
7.2 Bepaal die koördinate punt B, 'n
draaipunt van f(x).
7. The diagram below shows the graph of
f(x) = ax3 + bx2 + cx + d.
The Y-intercept is (0 ; 36).
7.1 Calculate the values of a, b, c and d
and thus the equation of f(x).
7.2 Determine the coordinates of point B a
turning point of f(x).
f(x) = ax3 + bx2 + cx + d.
The Y-intercept is (0 ; 36).
7.1 Calculate the values of a, b, c and d
and thus the equation of f(x).
7.2 Determine the coordinates of point B a
turning point of f(x).
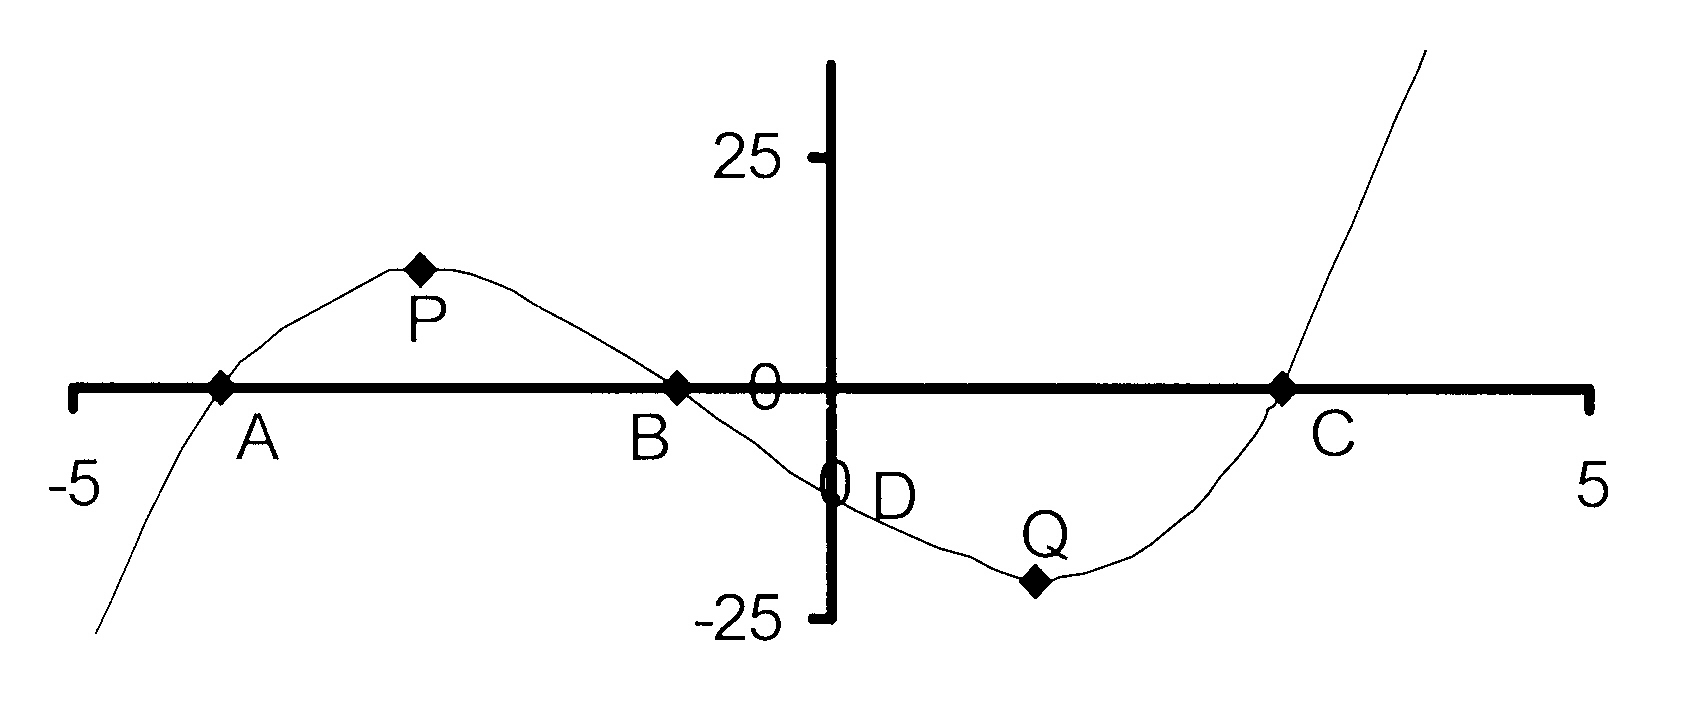
8. Die skets hieronder toon die grafiek van
f(x) = ax3 + bx2 + cx + d.
A(−5 ; 0), B(1 ; 0) en C(4 ; 0) is die
X-afsnitte. D is die punt (−4 ; 40).
8.1 Bereken die waardes van a, b, c en d
en dus die vergelyking van f(x).
8.2 Vir watter waarde(s) van x is f'(x) < 0?
8.3 Bepaal die koördinate van die lokale maksimum.
f(x) = ax3 + bx2 + cx + d.
A(−5 ; 0), B(1 ; 0) en C(4 ; 0) is die
X-afsnitte. D is die punt (−4 ; 40).
8.1 Bereken die waardes van a, b, c en d
en dus die vergelyking van f(x).
8.2 Vir watter waarde(s) van x is f'(x) < 0?
8.3 Bepaal die koördinate van die lokale maksimum.
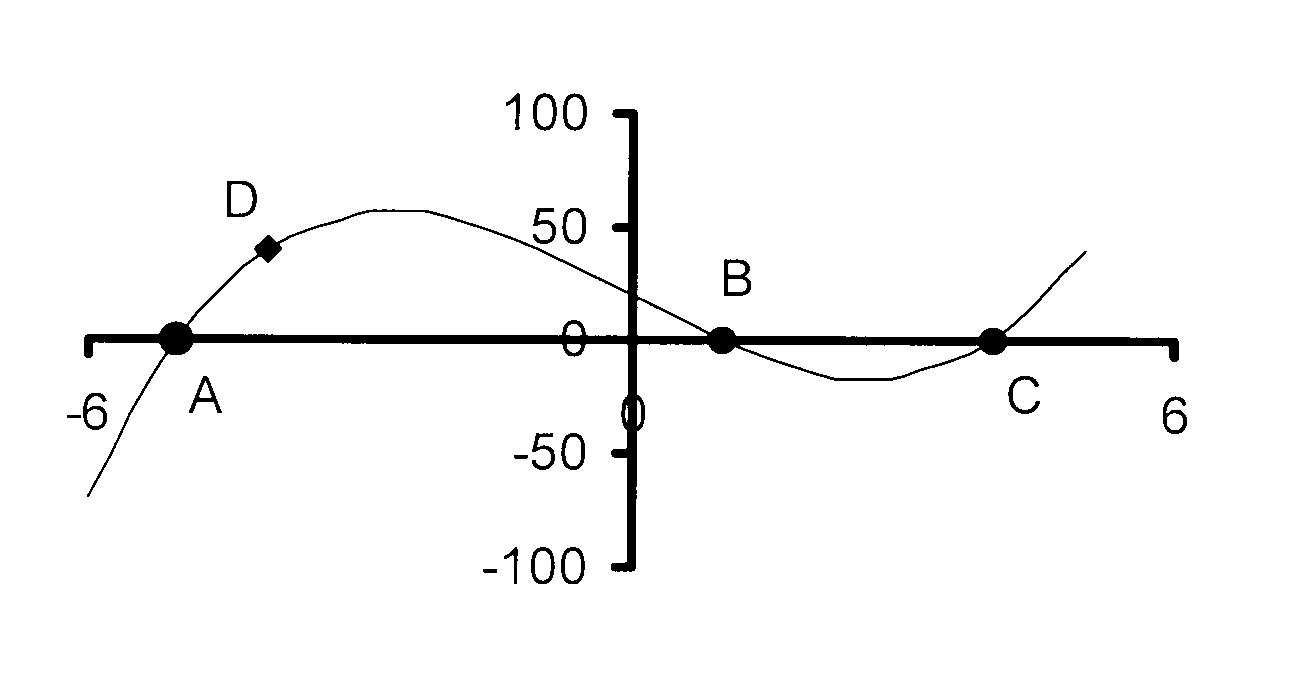
8. The diagram below shows the graph of
f(x) = ax3 + bx2 + cx + d.
A(−5 ; 0), B(1 ; 0) and C(4 ; 0) are the
X-intercepts. D is the point (−4 ; 40).
8.1 Calculate the values of a, b, c and d
and thus the equation of f(x).
8.2 For which value(s) of x will f'(x) < 0?
8.3 Determine the coordinates of the local maximum.
f(x) = ax3 + bx2 + cx + d.
A(−5 ; 0), B(1 ; 0) and C(4 ; 0) are the
X-intercepts. D is the point (−4 ; 40).
8.1 Calculate the values of a, b, c and d
and thus the equation of f(x).
8.2 For which value(s) of x will f'(x) < 0?
8.3 Determine the coordinates of the local maximum.
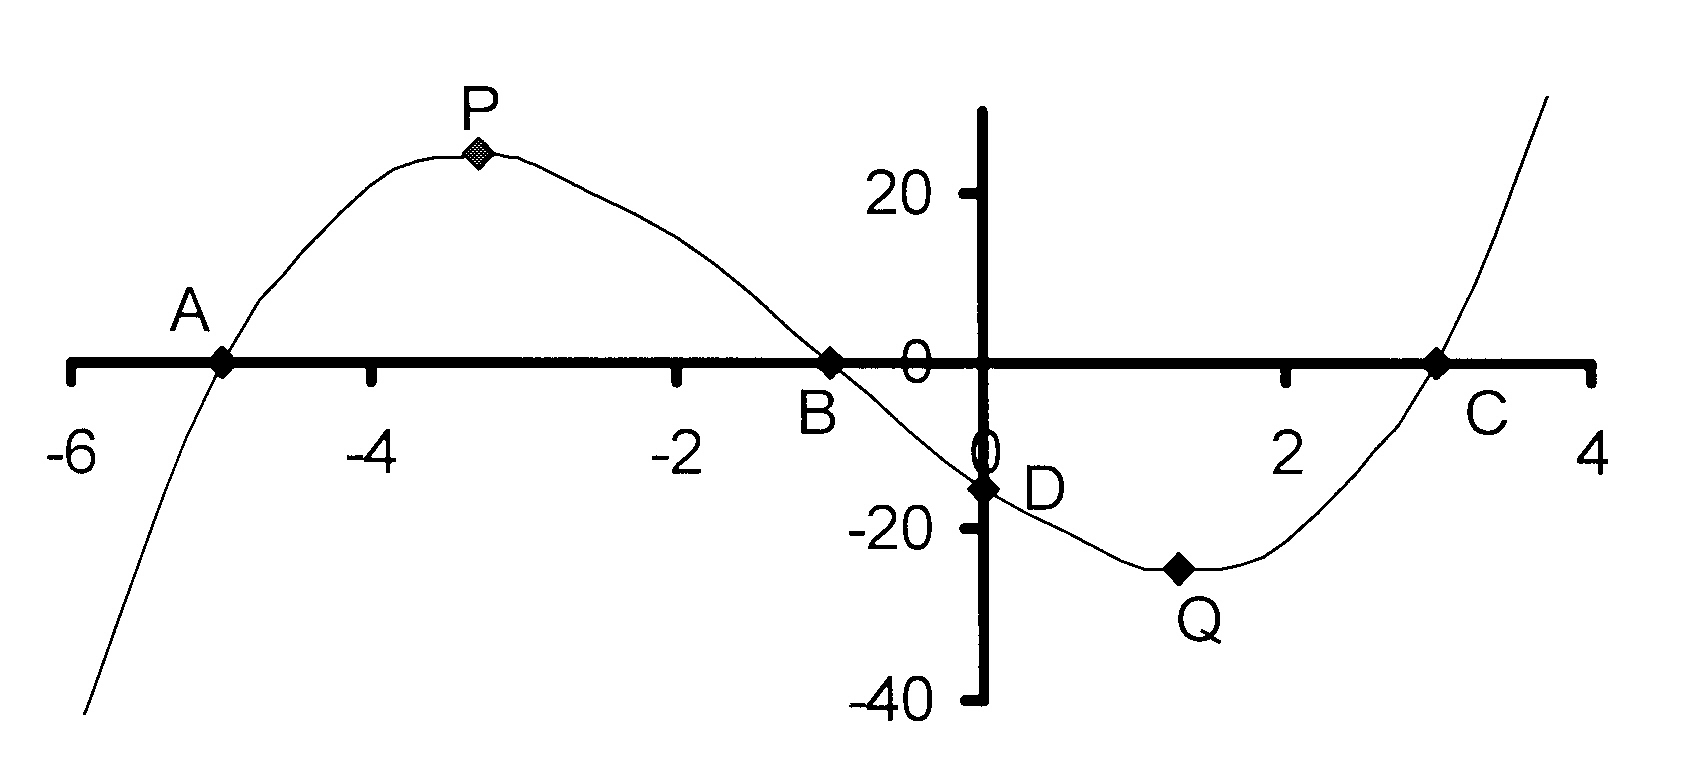
9. Die skets hieronder toon die grafiek van
f(x) = ax3 + bx2 + cx + d.
A(−4 ; 0), B(−2 ; 0) en C(3 ; 0) is die
X-afsnitte. D is die punt (0 ; 24).
9.1 Bereken die waardes van a, b, c en d
en dus die vergelyking van f(x).
9.2 Vir watter waarde(s) van x is
9.2.1 f(x) < 0?
9.2.2 f'(x) < 0?
f(x) = ax3 + bx2 + cx + d.
A(−4 ; 0), B(−2 ; 0) en C(3 ; 0) is die
X-afsnitte. D is die punt (0 ; 24).
9.1 Bereken die waardes van a, b, c en d
en dus die vergelyking van f(x).
9.2 Vir watter waarde(s) van x is
9.2.1 f(x) < 0?
9.2.2 f'(x) < 0?
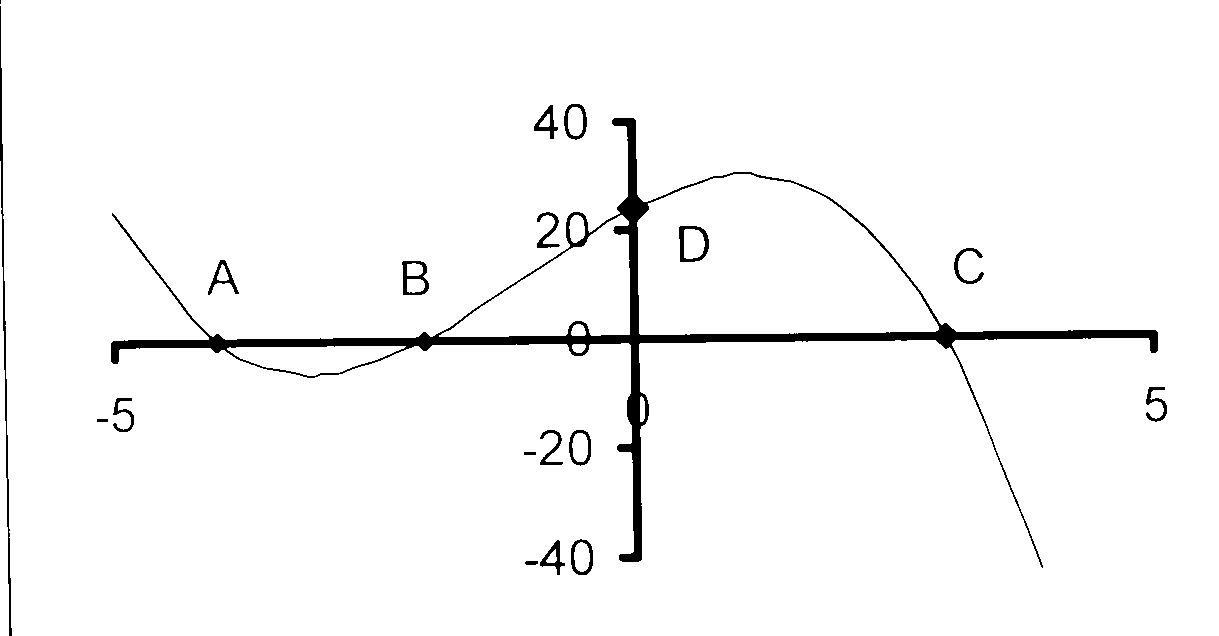
9. The diagram below shows the graph of
f(x) = ax3 + bx2 + cx + d.
A(−4 ; 0), B(−2 ; 0) and C(3 ; 0) are the
X-intercepts. D is the point (0 ; 24).
9.1 Calculate the values of a, b, c and d
and thus the equation of f(x).
9.2 For which value(s) of x will
9.2.1 f(x) < 0?
9.2.2 f'(x) < 0?
f(x) = ax3 + bx2 + cx + d.
A(−4 ; 0), B(−2 ; 0) and C(3 ; 0) are the
X-intercepts. D is the point (0 ; 24).
9.1 Calculate the values of a, b, c and d
and thus the equation of f(x).
9.2 For which value(s) of x will
9.2.1 f(x) < 0?
9.2.2 f'(x) < 0?
10. Die skets hieronder toon die grafiek van
f(x) = x3 + bx2 + cx + d.
A(0 ; 6) is die Y-afsnit en P(−2 ; 14)
is 'n draaipunt van f(x).
10.1 Bereken die waardes van b, c en d
en dus die vergelyking van f(x).
10.2 Vir watter waarde(s) van x is f'(x) < 0?
10.3 g(x) = f(x) + h. Vir watter waarde(s) van h
sal g(x) = 0 net een positiewe wortel hê?
f(x) = x3 + bx2 + cx + d.
A(0 ; 6) is die Y-afsnit en P(−2 ; 14)
is 'n draaipunt van f(x).
10.1 Bereken die waardes van b, c en d
en dus die vergelyking van f(x).
10.2 Vir watter waarde(s) van x is f'(x) < 0?
10.3 g(x) = f(x) + h. Vir watter waarde(s) van h
sal g(x) = 0 net een positiewe wortel hê?
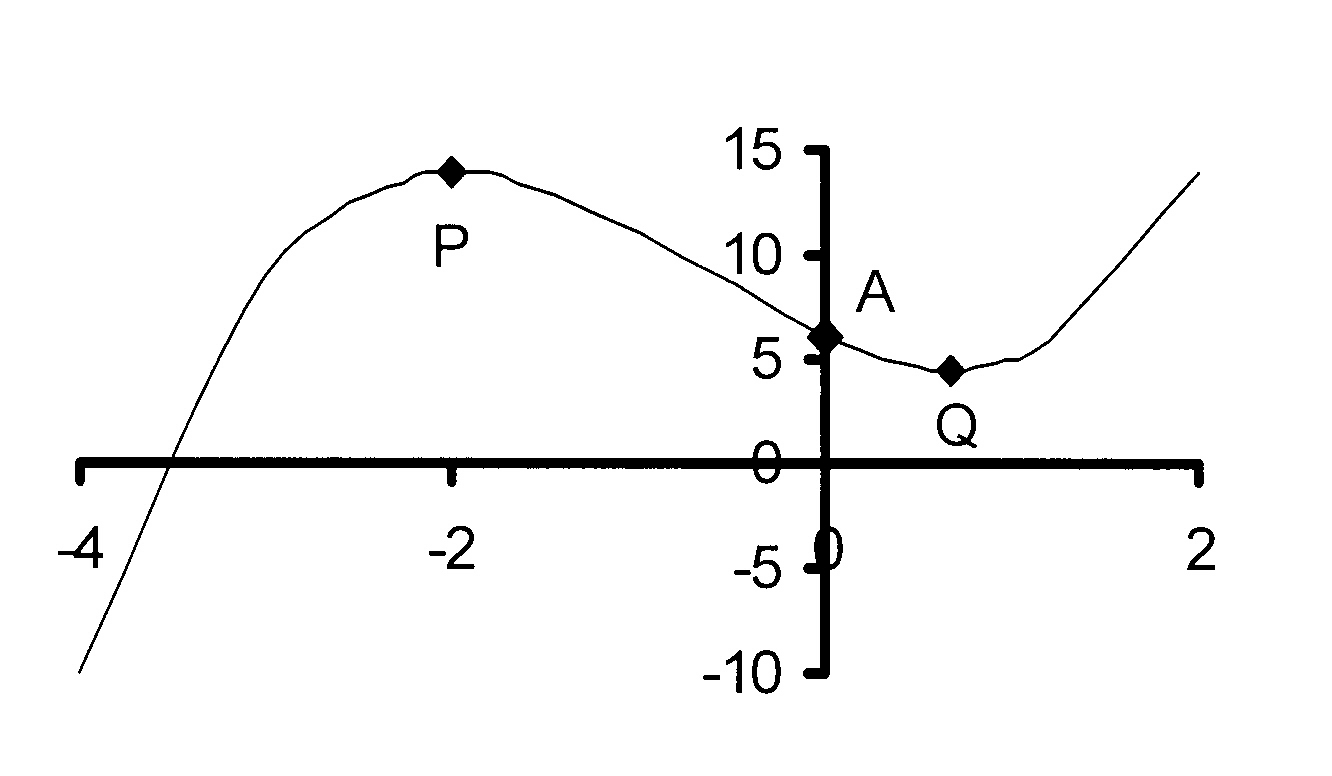
10. The diagram below shows the graph of
f(x) = x3 + bx2 + cx + d.
A(0 ; 6) is the Y-intercept and P(−2 ; 14)
is a turning point of f(x).
10.1 Calculate the values of b, c and d
and thus the equation of f(x).
10.2 For which value(s) of x will f'(x) < 0?
10.3 For which value(s) of h will g(x) = 0) have
only one positive root, if g(x) = f(x) + h?
11. Die skets hieronder stel die grafiek van
f(x) = ax3 + bx2 + cx + d voor.
P(−1 ; 24) en Q(11/3 ; 2020/7) is die
draaipunte van f(x).
11.1 Bereken die waardes van a, b, c en d
en dus die vergelyking van f(x).
11.2 Bepaal die koördinate van die Y-afsnit.
11.3 Vir watter waarde(s) van x is
11.3.1 f'(x) > 0?
11.3.2 f(x) stygend?
f(x) = ax3 + bx2 + cx + d voor.
P(−1 ; 24) en Q(11/3 ; 2020/7) is die
draaipunte van f(x).
11.1 Bereken die waardes van a, b, c en d
en dus die vergelyking van f(x).
11.2 Bepaal die koördinate van die Y-afsnit.
11.3 Vir watter waarde(s) van x is
11.3.1 f'(x) > 0?
11.3.2 f(x) stygend?
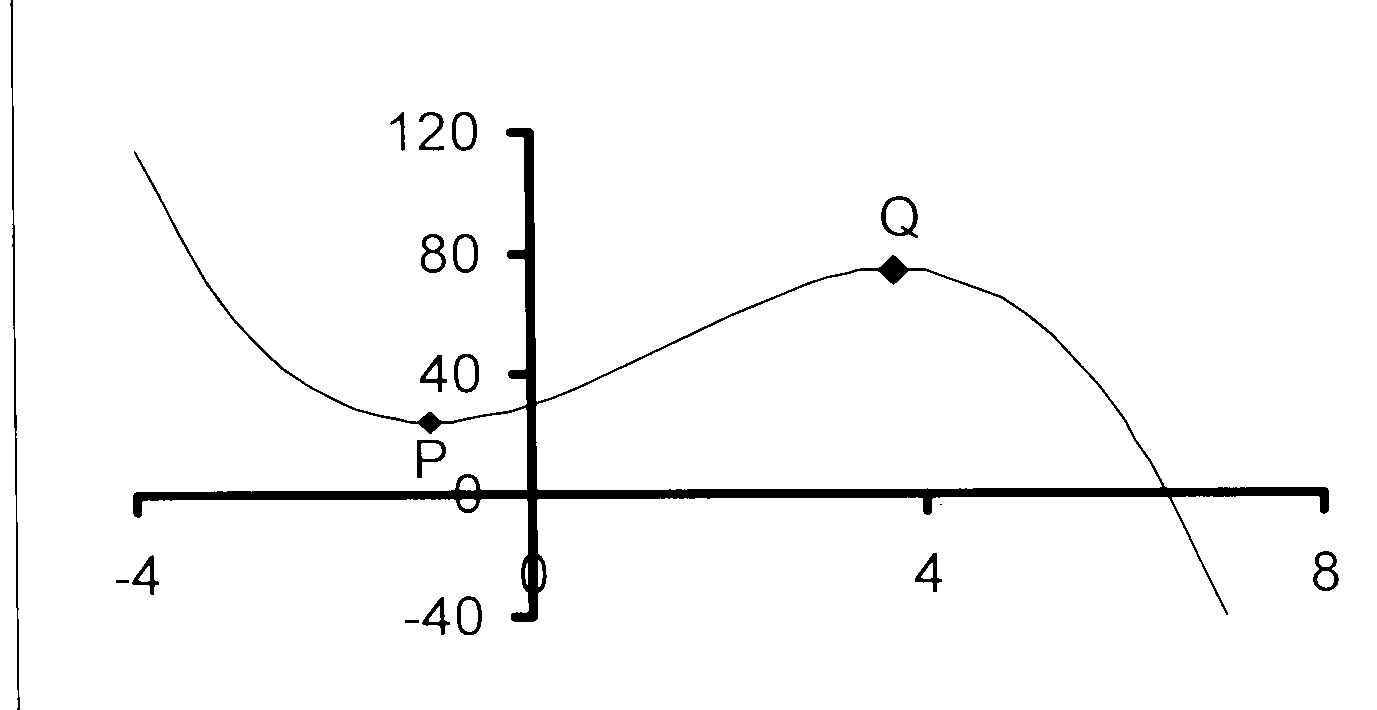
11. The diagram below represents the graph of
f(x) = ax3 + bx2 + cx + d.
P(−1 ; 24) and Q(11/3 ; 2020/7) are
the turning points of f(x).
10.1 Calculate the values of a, b, c and d
and thus the equation of f(x).
11.2 Write down the coordinates of the Y-intercept.
11.3 For which value(s) of x will
11.3.1 f'(x) > 0?
11.3.2 f(x) be descending?
f(x) = ax3 + bx2 + cx + d.
P(−1 ; 24) and Q(11/3 ; 2020/7) are
the turning points of f(x).
10.1 Calculate the values of a, b, c and d
and thus the equation of f(x).
11.2 Write down the coordinates of the Y-intercept.
11.3 For which value(s) of x will
11.3.1 f'(x) > 0?
11.3.2 f(x) be descending?
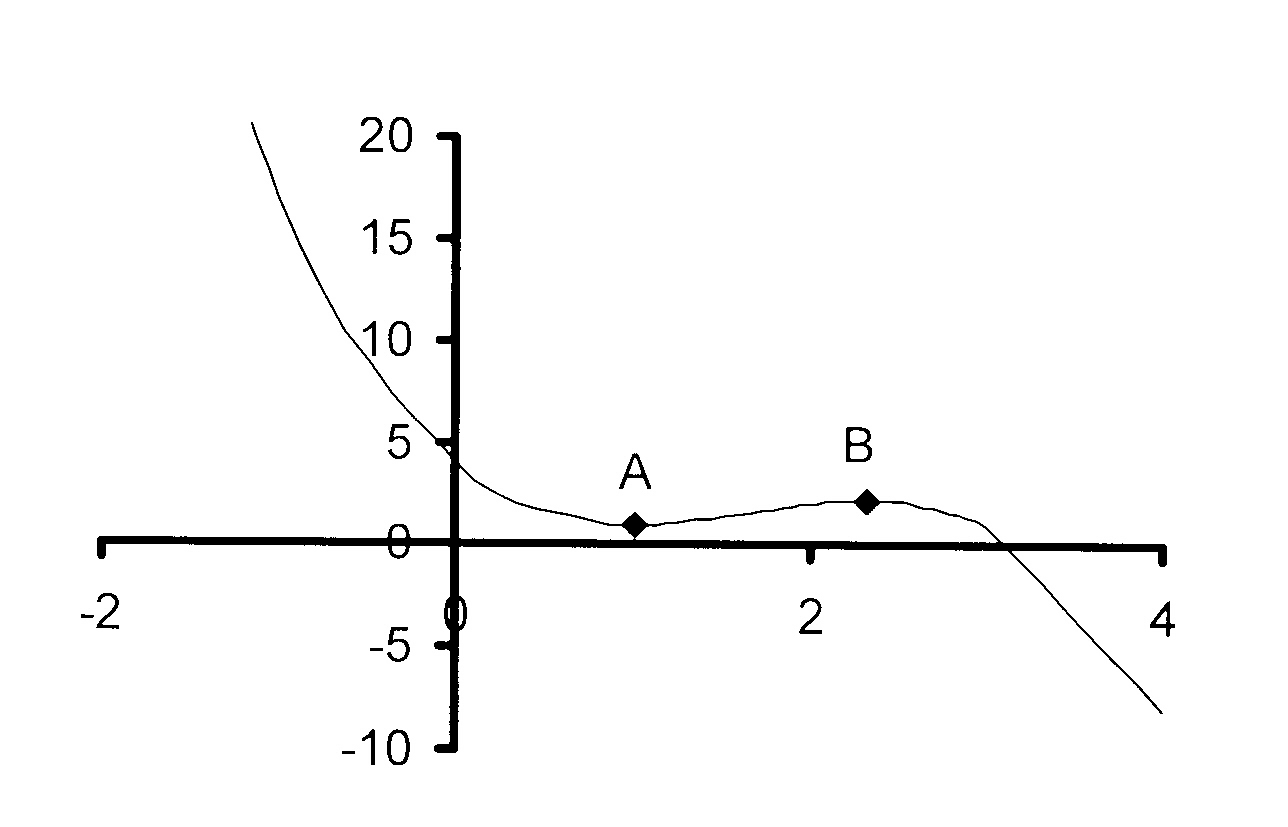
12. Die skets hieronder stel die grafiek van
f(x) = ax3 + bx2 + cx + d voor.
A(1 ; 1) en B(7/3 ; 59/27) is die
draaipunte van f(x).
12.1 Bereken die waardes van a, b, c en d
en dus die vergelyking van f(x).
12.2 Bepaal die koördinate van die Y-afsnit.
12.3 Vir watter waarde(s) van x is
12.3.1 f'(x) < 0?
12.3.2 f(x) stygend?
f(x) = ax3 + bx2 + cx + d voor.
A(1 ; 1) en B(7/3 ; 59/27) is die
draaipunte van f(x).
12.1 Bereken die waardes van a, b, c en d
en dus die vergelyking van f(x).
12.2 Bepaal die koördinate van die Y-afsnit.
12.3 Vir watter waarde(s) van x is
12.3.1 f'(x) < 0?
12.3.2 f(x) stygend?
12. The diagram below represents the graph of
f(x) = ax3 + bx2 + cx + d.
A(1 ; 1) and B(7/3 ; 59/27) are
the turning points of f(x).
12.1 Calculate the values of a, b, c and d
and thus the equation of f(x).
12.2 Write down the coordinates of the Y-intercept.
12.3 For which value(s) of x will
12.3.1 f'(x) < 0?
12.3.2 f(x) be ascending?
f(x) = ax3 + bx2 + cx + d.
A(1 ; 1) and B(7/3 ; 59/27) are
the turning points of f(x).
12.1 Calculate the values of a, b, c and d
and thus the equation of f(x).
12.2 Write down the coordinates of the Y-intercept.
12.3 For which value(s) of x will
12.3.1 f'(x) < 0?
12.3.2 f(x) be ascending?