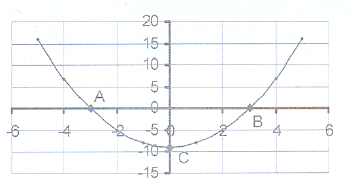
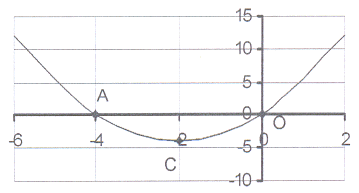
 1. The sketch shows the graph of y = x² – 9.
 1.1 Calculate the co-ordinates of the intercepts on
the axes - points A, B and C.
1.2.1 Does the graph have a maximum or a
minimum value ?
1.2.2 What is this value and where on the graph is
this value reached?
1.3 Write down the lengths of AO, OB, OC, AB and AC.
1.4 What is y's value if
1.4.1 x = -4?
1.4.2 x = 4,5 ?
1.5 What is x's value if
1.5.1 y = -5?
1.5.2 y = 5 ?
1.6 For which value(s) of x will
1.6.1 x² – 9 = 0 ? 1.6.2 x² – 9 < 0 ? 1.6.3 x² – 9 > 0 ?
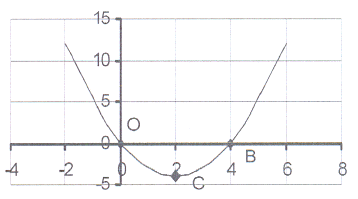
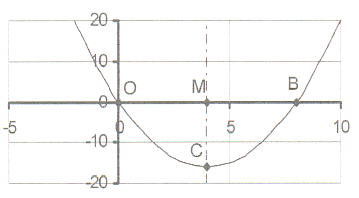
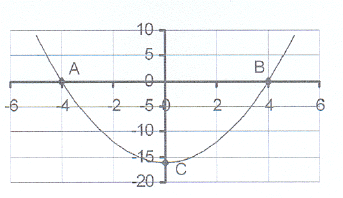 2. The sketch shows the graph of y = x² – 16.
 2.1 Calculate the co-ordinates of the intercepts on
the axes - points A, B and C.
2.2.1 Does the graph have a maximum or
a minimum value?
2.2.2 What is this value and where on the graph is
this value reached?
2.3 Write down the lengths of AO, OB, OC, AB and AC.
2.4 What is the value of y if
2.4.1 x = -3?
2.4.2 x = 1 ?
2.5 What is the value of x if
2.5.1 y = -10?
2.5.2 y = 5 ?
2.6 For which value(s) of x will
2.6.1 x² – 16 = 0 ? 2.6.2 x² – 16 < 0 ? 2.6.3 x² – 16 > 0 ?
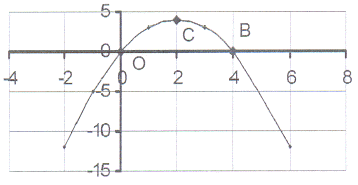
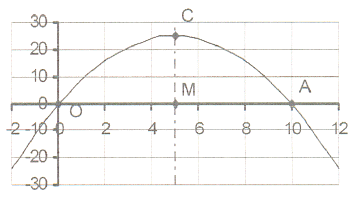
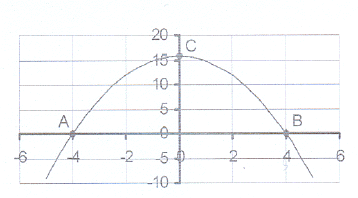 3. The sketch shows the graph of y = 16 – x² .
 3.1 Calculate the co-ordinates of the intercepts on
the axes - points A, B and C.
3.2.1 Does the graph have a maximum or
a minimum value?
3.2.2 What is this value and where on the graph is
this value reached?
3.3 Write down the lengths of AO, OB, OC, AB and AC.
3.4 What is the value of y if
3.4.1 x = -3?
3.4.2 x = 1,5 ?
3.5 What is the value of x if
3.5.1 y = -5?
3.5.2 y = 10 ?
3.6 For which value(s) of x will
3.6.1 16 – x² = 0 ? 3.6.2 16 – x² < 0 ? 3.6.3 16 – x² > 0 ?
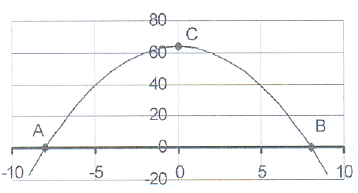 4. The sketch shows the graph of y = 64 - x²
 4.1 Calculate the co-ordinates of the intercepts on
the axes - points A, B and C.
4.2.1 Does the graph have a maximum or
a minimum value?
4.2.2 What is this value and where on the graph is
this value reached?
4.3 Write down the lengths of AO, OB, OC, AB and AC.
4.4 What is the value of y if
4.4.1 x = -5?
4.4.2 x = 3 ?
4.5 What is the value of x if
4.5.1 y = 10?
4.5.2 y = 20 ?
4.6 For which value(s) of x will
4.6.1 64 - x² = 0 ? 4.6.2 64 - x² < 0 ? 4.6.3 64 - x² > 0 ?
5. Given that y = x² – 4
5.1 Calculate the co-ordinates of the points of intersection on the axes.
5.2 Sketch the graph and mark the intercept on the negative x-axis, A, the intercept on the positive x-axis B,
and the intercept on the y-axis, C.
5.3 Given that the points P(-1,75 ; p) and Q(q ; 3) are points on the parabola. Calculate the value of
p and of q and mark the points on your graph.
6. Given that y = x² – 25
6.1 Calculate the intercepts on the axes.
6.2 Sketch the graph and mark the intercept on the negative x-axis, A, the intercept on the positive x-axis B,
and the intercept on the y-axis, C.
6.3 Given that the points P(4,3 ; p) and Q(q ; -15) are points on the parabola. Calculate the value of
p and of q and mark the points on your graph.
7. Given that y = 36 - x²
7.1 Calculate the intercepts on the axes.
7.2 Sketch the graph and mark the intercept on the negative x-axis, A, the intercept on the positive x-axis B,
and the intercept on the y-axis, C.
7.3 Given that the points P(-4,25 ; p) and Q(q ; 10) are points on the parabola. Calculate the value of
p and of q and mark the points on your graph.
8. Given that y = 49 - x²
8.1 Calculate the intercepts on the axes.
8.2 Sketch the graph and mark the intercept on the negative x-axis, A, the intercept on the positive x-axis B,
and the intercept on the y-axis, C.
8.3 Given that the points P(3,8 ; p) and Q(q ; 23) are points on the parabola. Calculate the value of
p and of q and mark the points on your graph.
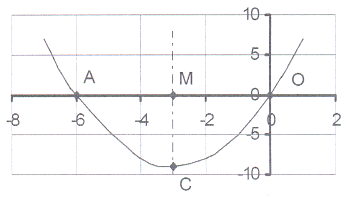
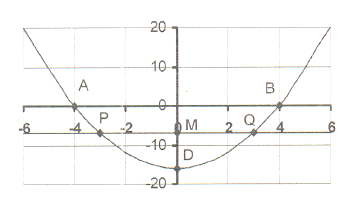 9. The sketch shows the graph of y = x² + c
 The graph intersects the X-axis in the points
A(-4 ; 0) and B(4 ; 0)
9.1 Calculate the equation of the parabola and
thus the value of c.
9.2 Write down the co-ordinates of point D, the
intercept on the Y-axis.
9.3 The line y = -7, intersects the parabola in points
P and Q and the Y-axis in point M.
Calculate the co-ordinates of P, Q and M.
9.4 Write down the lengths of each of the
following: AO, OB, OD, PM, MQ,
AB, PQ, OM, MD, PD and OQ.
9.5 For which value(s) of x will
9.5.1 x² + c = 0? 9.5.2 x² + c < 0? 9.5.3 x² + c > 0?
9.5.4 x² + c = -7? 9.5.5 x² + c < -7? 9.5.6 x² + c > -7?
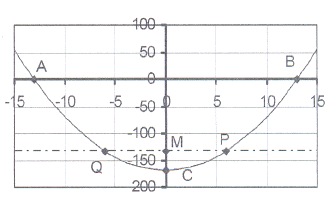 10. The sketch shows the graph of y = x² + c
 The graph intersects the X-axis in the points
A(-13 ; 0) and B(13 ; 0)
10.1 Calculate the equation of the parabola and
thus the value of c.
10.2 Write down the co-ordinates of point C, the
intercept on the Y-axis.
10.3 The line y = -133, intersects the parabola in points
P and Q and the Y-axis in point M.
Calculate the co-ordinates of P, Q and M.
10.4 Write down the lengths of each of
the following: AO, OB, OC, PM, MQ,
AB, PQ, OM, MC, PC and OQ.
10.5 For which value(s) of x will
10.5.1 x² + c = 0? 10.5.2 x² + c < 0? 10.5.3 x² + c > 0? 10.5.4 x² + c = -133?
10.5.5 x² + c < -133? 10.5.6 x² + c > -133? 10.5.7 -133 < x² + c < 0?
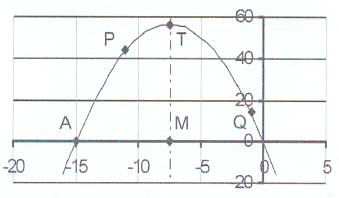
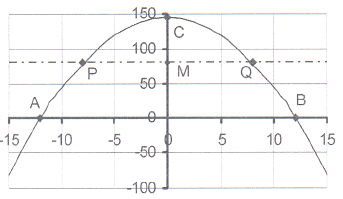 11. The sketch shows the graph of y = x² + c
 The graph intersects the X-axis in the
points A(-12 ; 0) and B(12 ; 0)
11.1 Calculate the equation of the parabola and thus
the value of c.
11.2 Write down the co-ordinates of point C, the
intercept on the Y-axis.
11.3 The line y = 80, intersects the parabola in the
points P and Q and the Y-axis in point M.
Calculate the co-ordinates of P, Q and M.
11.4 Write down the length of each of
the following: AO, OB, OC, PM, MQ,
AB, PQ, OM, MC, PC and OQ.
11.5 For which value(s) of x will
11.5.1 x² + c = 0? 11.5.2 x² + c < 0? 11.5.3 x² + c > 0? 11.5.4 x² + c = 80?
11.5.5 x² + c < 80? 11.5.6 x² + c > 80? 11.5.7 0 < x² + c < 80?
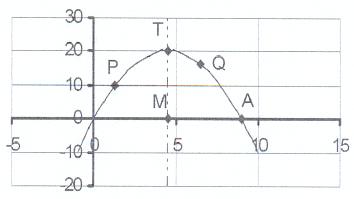
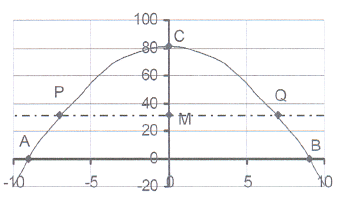 12. The sketch shows the graph of y = x² + c
 The graph intersects the X-axis in the
points A(-9 ; 0) and B(9 ; 0)
12.1 Calculate the equation of the parabola and thus
the value of c.
12.2 Write down the co-ordinates of point C, the
intercept on the Y-axis.
12.3 The line y = 32, intersects the parabola in points
P and Q and the Y-axis in point M.
Calculate the co-ordinates of P, Q and M.
12.4 Write down the length of each of
following: AO, OB, OD, PM, MQ,
AB, PQ, OM, MC, PC and OQ.
12.5 For which value(s) of x will
12.5.1 x² + c = 0? 12.5.2 x² + c < 0? 12.5.3 x² + c > 0? 12.5.4 x² + c = 32?
12.5.5 x² + c < 32? 12.5.6 x² + c > 32? 12.5.7 0 > x² + c > 32?
 13. The sketch shows the graph of y = x² + 4x
 13.1 Calculate the co-ordinates of the intercepts
on the axes.
13.2 Calculate the co-ordinates of the turning point C.
13.3 What is the minimum value?
13.4 Write down the length of AO.
13.5 The graph is symmetric about the line x = c.
Write down the value of c.
13.6 For which value(s) of x will
13.6.1 x² + 4x = 0?
13.6.2 x² + 4x < 0?
13.6.3 x² + 4x > 0?
 14. The sketch shows the graph of y = x² - 4x
 14.1 Calculate the co-ordinates of the intercepts
on the axes.
14.2 Calculate the co-ordinates of the turning point C.
14.3 What is the minimum value?
14.4 Write down the length of OB.
14.5 The graph is symmetric about the line x = c.
Write down the value of c.
14.6 For which value(s) of x will
14.6.1 x² - 4x = 0?
14.6.2 x² - 4x < 0?
14.6.3 x² - 4x > 0?
 15. The sketch shows the graph of y = 4x - x²
 15.1 Calculate the co-ordinates of the intercepts
on the axes.
15.2 Calculate the co-ordinates of the turning point C.
15.3 What is the maximum value?
15.4 Write down the length of OB.
15.5 The graph is symmetric about the line x = c.
Write down the value of c.
15.6 For which value(s) of x will
15.6.1 x² - 4x = 0?
15.6.2 x² - 4x < 0?
15.6.3 x² - 4x > 0?
 16. The sketch shows the graph of y = x² + cx
 The graph intersects the X-axis in A(-6 ; 0)
and O(0;0).
16.1 Calculate the equation of the parabola
and then write down the value of c.
16.2 MC is the axis of symmetry.
Write down the co-ordinates of M and
also write down the equation of MC.
16.3 Calculate the co-ordinates of of the turning point C.
16.4 Write down the maximum or minimum value.
16.5 Write down the length of AO, AM, MO and MC.
16.6 For which value(s) of x will
16.6.1 x² + cx = 0?
16.6.2 x² + cx < 0?
16.6.3 x² + cx > 0?
 17. The sketch shows the graph of y = x² + cx
 The line through M and C is the axis of symmetry.
The length of OM = 4 .
17.1 Write down the co-ordinates of M and B.
17.2 Calculate the equation f the graph and
write down the value of c.
17.3 Calculate the co-ordinates of the turning point C
and then write down the minimum value.
17.4 Write down the length of MC.
17.5 For which value(s) of x will
17.5.1 x² + cx = 0?
17.5.2 x² + cx < 0?
17.5.3 x² + cx > 0?
 18. The sketch shows the graph of y = x² + cx
 The graph intersects the X-axis in A(10 ; 0)
and O(0;0).
18.1 Calculate the equation of the graph
and then write down the value of c.
18.2 MC is the axis of symmetry.
Write down the coordinates of M and
also write down the equation of MC.
18.3 Calculate the co-ordinates of the turning point C.
18.4 Write down the maximum or minimum value.
18.5 Write down the length of AO, AM, MO and MC.
18.6 For which value(s) of x will
18.6.1 x² + cx = 0?
18.6.2 x² + cx < 0?
18.6.3 x² + cx > 0?
 19. The sketch shows the graph of y = ax² + bx
 Given that OA = 15, MA = 7,5 and MT = 56,25.
19.1 Write down the co-ordinates of A, M and T.
19.2 Calculate the equation of the parabola
and write down the values of a and b.
19.3 P is the point (-11 ; p). Calculate the value of p.
19.4 Q is the point (q ; 14). Calculate the value of q.
19.5 Show that the equation of the line passing
through points P and Q is given by y = -3x + 11
19.6 For which value(s) of x will
19.6.1 ax² + bx < 0 ? 19.6.2 ax² + bx > 0 ?
19.6.3 11 - 3x > 0 ? 19.6.4 11 - 3x = 0 ?
19.6.5 ax² + bx < 11 - 3x 19.6.6 ax² + bx > 11 - 3x
 20. The sketch shows the graph of y = 9x - x²
 20.1 Calculate the co-ordinates of points A, M and T.
MT is the axis of symmetry.
20.2 Write down the length of OA, MA and MT.
20.3 P is the point (1,3 ; p). Calculate the value of p.
20.4 Q is the point (q ; 16,25). Calculate the value of q.
20.5 The line y = 16,25 passes through Q and intersects
the parabola in a second point. Write down
the co-ordinates of this point.
20.6 Calculate the equation of the line passing through
the points P and Q.
20.7 For which value(s) of x will
20.7.1 9x - x² < 0 ? 20.7.2 9x - x² < 0 ? 20.7.3 1,2x + 8,45 = 0
20.7.4 1,2x + 8,45 < 0? 20.7.5 9x - x² < 1,2x + 8,45 20.7.6 9x - x² > 1,2x + 8,45 ?