Grade 12 - More exercises.
Different kinds of graphs.
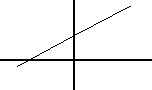
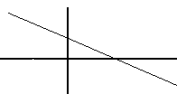
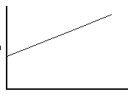
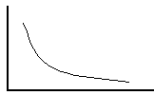
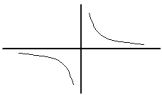
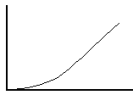
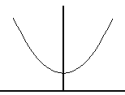
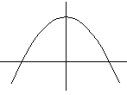
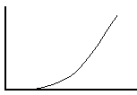
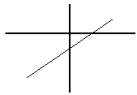
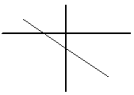
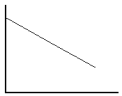
1.
The diagrams
below show the graphs of variables a and b. Variable a is plotted on the
horisontal axis,
the x-axis, and b on the vertical axis, the y-axis.
What
is the relationship between a and b? Give reasons. Use the expressions directly
proportional, inversely
proportional or unknown to describe the relationship between a and b.
1.1
1.2
1.3
1.4
1.5
1.6
1.7
1.8
1.9
1.10
1.11
1.12
2.
The table
below shows the cost to manufacture n articles:
| Number of articles, n |
1 |
2 |
5 | 6 |
8 |
| Cost |
4 |
8 |
20 | 24 |
32 |
2.1
Will the
cost to manufacture n articles be directly proportional to n, the number of articles?
Explain.
2.2
What shape
will the graph have if number of articles is plotted on the x-axis and cost
on the y-axis? Explain your answer.
2.3
Draw the
graph of number of articles on the x-axis and cost on the y-axis.
2.4
Does the
graph have the shape which you predicted in 2.2?
2.5
Read from
the graph the following values and clearly mark the point where you took the reading
with the letter in brackets:
2.5.1
cost
to manufacture 4 articles (P).
2.5.2
the
number of articles that can be manufactured if the cost is R26. (Q)
2.6
Is the
answer in 2.5.2 a suitable answer? Explain.
3.
The table
below shows the number of hours that a number of men must work to complete a task:
| Number of men |
1 | 2 |
3 | 6 |
16 | 24 |
48 |
| Number of hours |
48 | 24 |
16 | 8 |
3 | 2 |
1 |
3.1
Is
the number of hours directly proportional to the number of men? Explain.
3.2
What shape
will the graph of the data above have if number of men is plotted on the x-axis and
number of hours is plotted on the y-axis? Explain.
3.3
Draw the
graph with number of men on the x-axis and the number of hours on the y-axis.
3.4
Does the
graph have the predicted shape?
3.5
Read the
requested values from the graph and clearly mark the point where you made the reading.
3.5.1
How many
hours must 5 men work to complete the task? Is it a suitable answer? Explain.
3.5.2
How many men
must work for 20 hours to complete the task? Is it a suitable answer? Explain.
3.6
What is the
greatest number of hours needed to complete the task if everybody works at the
same rate?
Explain.
3.7
Can the
work be completed in 15 minutes? How many men will be needed? Is it a suitable
answer? Explain.
4.
In an
experiment a student obtains the following values:
| a |
0 | 1 |
2 | 3 |
4 | 8 |
| b |
0 | 3 |
6,05 | 7,9 |
12,5 | 23,9 |
4.1
Can the
student claim that b is directly propotional to a? Explain.
4.2
Write down
the relationship between a and b in words and in symbols.
4.3
What shape
will the graph of a, on the x-axis, and b, on the y-axis, have? Explain.
4.4
Draw the
graph of a, on the x-axis, and b, on the y-axis.
4.5
Read from
the graph the following values and mark the point where you take the reading with the
letter in brackets:
4.5.1
the
value of b if a = 6 (P)
4.5.2
the
value of a if b = 10,5 (Q)
4.6
Use
the formula that you wrote down in 4.2 to calculate the values of a and b in 4.5.1 and 4.5.2
How do
the calculated values correspond with the values read from the graph?
5.
The table
below contains values for a and b.
5.1
Is b
directly proportional to a? Motivate your answer.
5.2
Describe the
relationship between a and b in words and in symbols.
5.3
What shape
will the graph of a against b have? Motivate your answer.
5.4
Draw the
graph of a, on the x-axis, and b, on the y-axis.
5.5
Read from
the graph the following values and mark the point where you take the reading with the
letter in brackets:
5.5.1
the
value of b if a = 8 (P)
5.5.2
the
value of a if b = 10 (Q)
5.6
Use
the formula that you wrote down in 5.2 to calculate the values of a and b in 5.5.1 and 5.5.2
How do the calculated values correspond with the values read from the graph?
6.
Values for
a and b are given in the table below.
6.1
Is b
directly proportional to a? Motivate your answer.
6.2
Describe the
relationship between a and b in words and in symbols.
6.3
What will
the shape of the graph of a against b be? Motivate your answer.
6.4
Draw the
graph of a, on the x-axis, and b, on the y-axis.
6.5
Read from
the graph the following values and mark the point where you take the reading with the
letter in brackets:
6.5.1
the
value of b if a = 1,5 (Q)
6.5.2
the
value of a if b = 9 (P)
6.6
Use
the formula that you wrote down in 6.2 to calculate the values of a and b in 6.5.1 and 6.5.2
How do the calculated values correspond with the values read from the graph?
7.
A farmer
wants to make a coop with an area of 36 m². Please help the farmer.
7.1
Write down the
relationship between the length and breadth of the coop in words and in symbols.
7.2
What shape
will the graph of length, on the x-axis, and breadth, on the y-axis, have? Explain.
7.3
Draw up a
table containing suitable possible values for the length and breadth of the coop.
7.4
Draw the
graph, f, of length on the x-axis and breadth on the y-axis.
7.5
Read the
following measurements from the graph and clearly mark the point where you take
the reading with the letter in brackets:
7.5.1
the
breadth if the length is 3 m (P).
7.5.2
the length
if the breadth is 20 m. (Q)
7.6
Draw the
line g: y = x and let f and g intersect at R. Write down the co-ordinates of R.
7.7
What is
special about point R?
7.8
The farmer
wants the coop to be a square. Read from the graph the length of the sides of the square
and
mark the point where the readings are taken.
7.9
What length
of wire netting will be necessary to fence in the coop?
7.10
The farmer
has 24,4 m of wire netting to use. What will the measurements of the coop be?