Grade 11 - More exercises.
Parabola.
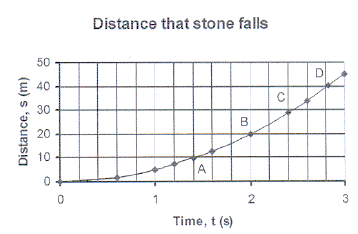
1.
The accompanying
sketch shows the graph
of the distance that
a stone falls.
The formula
used to calculate the distance,
2
is given by
s = 5t
1.1
Calculate the
co-ordinates of the
unmarked
points on the graph and then
complete
the table below:
Time, t
(s) 0 0,6
c d
Distance, s
(m) a b 5
7,2
Time, t
(s) e
2,4 g 3
Distance, s (m) 12,8
f 33,8 h
1.2
From the graph
read the answers to the following questions:
1.2.1
The time
taken to
1.2.1.1
fall 10 m.
1.2.1.2
fall 40 m.
1.2.2
The distance
that the stone falls in
1.2.2.1
2 seconds.
1.2.2.2
2,4 seconds.
1.3
What is the
greatest distance that the stone can fall in 2,6 seconds? Read your answer
from the graph and
then calculate the answer by using the formula.
How do
your answers compare?
1.4
What is
the shape of the graph?
1.5
Is
distance fallen and time taken, directly proportional to each other? Explain.
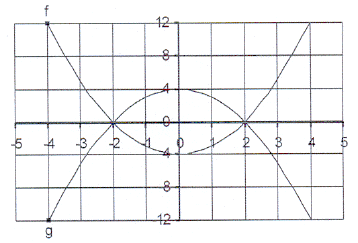
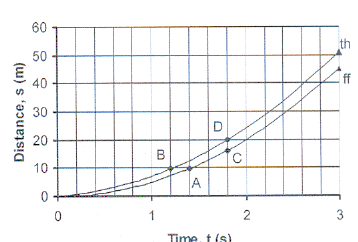 2. The accompanying sketch shows the graphs of the
movement of two identical stones.
One stone is allowed to fall and the other stone is
thrown downwards.
2.1 Which stone will move the greatest distance
in 1 second? Explain.
2.2 Which graph, ff or th, shows the movemnet of
the stone that is allowed to fall?
2.3 How long does it take each stone to move 10 m?
Where on the graph can you read the answers?
2.4 How far does each stone move in 1,8 seconds?
Which letter on the graph gives each answer?
2.5 Which stone will first fall 40 m and how long does
it take to fall 40 m?
2.6 Is the distance directly proportional to the time
taken for the fall? Explain.
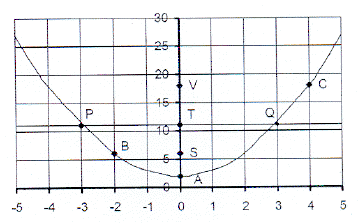
3. The table below shows values for the area of a circle. Take pi = 3 to
simplify the calculations.
Diameter 1 2
c d
3,6 f
Area
a b
4,32 6,75 e 12
3.1 Calculate the value of each letter in the table.
3.2 Is the diameter directly proportional to the area? Explain.
3.3 What will be the shape of the graph of the diameter, on the x-axis,
against area, on the y-axis? Explain.
3.4 Draw the graph of diameter, on the x-axis, against area, on the y-axis.
Use values from 0 to 4 for the diameter.
3.5 Does the form of the graph confirm your answer in 3.2?
3.6 Read the anwsers to the follwing questions from the graph and mark the point where
you
took the reading with the letter in brackets :
3.6.1 The ares if the diametr is 4 m. (A)
3.6.2 The diameter if the area is 2,43 square metres. (B)
3.6.3 The area if the diametr is 3,2 cm. (C)
3.6.4 The diameter if the area is 4,32 square cm. (Q)
3.6.5 The area if the diameter is 1,5 m. (P)
3.7 Use the formula and calculate the values. Compare them to the readings
from the graph.
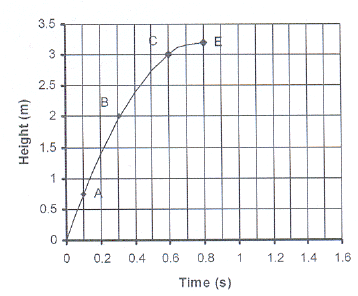
4.
The accompanying sketch
shows the graph
of a brick that is
thrown upwards to a
worker standing
on a scaffold.
The height,
h (in metre), that the brick
reaches after
t seconds, is
2
given by
h = 8t - 5t
4.1
Read from the
graph
4.1.1
the
height of the brick after 0,1 seconds.
4.1.2
the time
that the brick takes to
reach a height
of 2 m.
4.1.3
the maximum
height that the
brick reaches.
4.2
Use the
formula to calculate the
answers in
4.1 .
4.3
The worker on
the scaffold misses the
brick and it
falls to the ground.
Sketch on the
given system of axes the graph that represents the movement to the ground.
4.4
Read from
the graph the
4.4.1
time taken
to reach the ground.
4.4.2
total
time that the brick moved.
4.4.3
times at
which the brick was 3 m above the ground.
4.4.4
total time
that the sbrick was 3 m or higher.
4.4.5
times at which
the brick was 0,75 m above the ground.
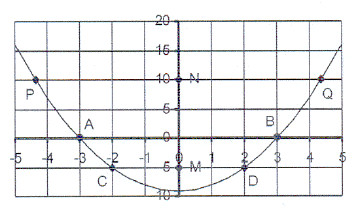
5.
The accompanying
sketch shows the graph
2
of y = x
- 9 = 0
5.1.1
Write down
the co-ordinates of points C and D.
5.2.1
From the graph
read the following values
and also
write down the letter of the point
on the graph:
2
5.2.1.1
the roots
of the equation x - 9 = 0
2
5.2.1.2
the roots
of the equation x - 4 = 0
5.3
Write down the
length of each of the following lines:
5.3.1
AO
5.3.2
OM
5.3.3
AB
5.3.4
PQ
5.3.5
MN
5.3.6
NQ
5.4
Write down the
equation of the line passing through points P, N and Q.
6.
The accompanying sketch
shows the grah
2
of y = x
- 4
6.1
Read the
points of interscetion of f
with the
x-axis from the graph.
6.2
Write down
the roots of the equation
2
x - 4 = 0 .
6.3
Solve the
equation by calculating
2
the roots:
x - 4 = 0.
6.4
For which
value(s) of x is
2
2
6.4.1
x - 4 = 0
6.4.2
x - 4 > 0
2
6.4.3
x - 4 < 0
6.5
Write down
the equation of the graph of g.
6.6
For which
value(s) of x is
6.6.1
g = 0
6.6.2
g > 0
6.6.3
g < 0
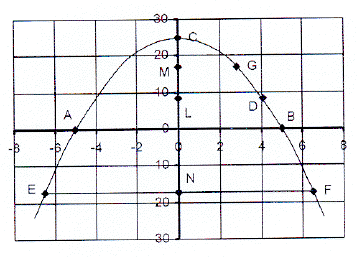
7.
The accompanying
sketch shows the graph
2
of y = x
+ 2
7.1
Calculate the
co-ordinates of points
A, B, C and Q.
V, T
and S are points on the Y-axis so that
VC, PTQ
and BS are parallel to the X-axis.
7.2
Write down
the lengths of BS, PT and PQ.
7.3
Write down
the equation of the line PTS.
7.4
Write down
the co-ordinates of the points
V,
T and S.
7.5
Write down
the length of AS, TS and VA.
7.6
Calculate the
length of PS and QA.
7.7
Read from the
graph the solution of the
2
equation:
x + 2 = 0
8.
The accompanying
sketch shows the graph
2
of y = 25 - x
8.1
Calculate the
co-ordinates of points A, B
and C.
8.2
D is the
point (4,1 ; 8,19). Write down
the co-ordinates
of L and the length
of LD.
8.3
MO = 17. Calculate
the co-ordinates of G
and the
length of MG.
8.4
EN = 6,5 and N is
the point (0 ; -17,25).
Write down the
co-ordinates of
E and F and
also the length of EF.
8.5
Write down
the length of CO, ML, CN
and MN.
8.6
Calculate the
length of AN and LG.
2
8.7
Read from the
graph the roots of 25 - x = 0 .
8.8
Use the
graph to solve the following equations. Write down the roots and also the names
of the
points where you took the readings:
2
2
2
8.8.1
25 - x = 0
8.8.2
25 - x = -17,25
8.8.3
42,25 - x = 0
8.9
For which
value(s) of x is
2
2
2
8.9.1
25 - x > 0
8.9.2
25 - x > -17,25
8.9.3
25 - x < 8,19