MATHEMATICS
Grade 11
MORE EXERCISES
Graphs of the trigonometric functions.
  
        Question  1
     Sketch the graphs of the following
     functions :
     $$ \hspace*{2 mm}\mathrm{1.1\kern3mmy = 2\ sin\ x − 1\ \ and\ \ x ∈ [-360° ; 360°]\kern2mm\ } $$
                                                                                 [ A 1.1 ]
     $$ \hspace*{2 mm}\mathrm{1.2\kern3mmy = 1 − 2 sin\ x\ \ and\ \ x ∈ [-360° ; 360°]\kern2mm\ } $$
                                                                                 [ A 1.2 ]
     $$ \hspace*{2 mm}\mathrm{1.3\kern3mmy = 2\ cos\ x\ − 1\ and\ \ x ∈ [-360° ; 360°]\kern2mm\ } $$
                                                                                 [ A 1.3 ]
     $$ \hspace*{2 mm}\mathrm{1.4\kern3mmy = 1 − 2\ cos\ x\ \ and\ \ x ∈ [-360° ; 360°]\kern2mm\ } $$
                                                                                 [ A 1.4 ]
     $$ \hspace*{2 mm}\mathrm{1.5\kern3mmy = sin\ (x − 30°)\ \ and\ \ x ∈ [-360° ; 360°]\kern2mm\ } $$
                                                                                 [ A 1.5 ]
     $$ \hspace*{2 mm}\mathrm{1.6\kern3mmy = sin\ (x + 60°)\ \ and\ \ x ∈ [-360° ; 360°]\kern2mm\ } $$
                                                                                 [ A 1.6 ]
     $$ \hspace*{2 mm}\mathrm{1.7\kern3mmy = cos\ (x − 60°)\ \ and\ \ x ∈ [-360° ; 360°]\kern2mm\ } $$
                                                                                 [ A 1.7 ]
     $$ \hspace*{2 mm}\mathrm{1.8\kern3mmy = cos\ (x + 30°)\ \ and\ \ x ∈ [-360° ; 360°]\kern2mm\ } $$
                                                                                 [ A 1.8 ]
     $$ \hspace*{2 mm}\mathrm{1.9\kern3mmy = 1 − sin x\ \ and\ \ x ∈ [-90° ; 180°]\kern2mm\ } $$
                                                                                 [ A 1.9 ]
     $$ \hspace*{2 mm}\mathrm{1.10\kern3mmy = 3 cos\ x\ − 2\ \ and\ \ x ∈ [-180° ; 180°]\kern2mm\ } $$
                                                                                 [ A 1.10 ]
     $$ \hspace*{2 mm}\mathrm{1.11\kern3mmy = sin\ (x − 30°)\ and\ \ x ∈ [-180° ; 180°]\kern2mm\ } $$
                                                                                 [ A 1.11 ]
     $$ \hspace*{2 mm}\mathrm{1.12\kern3mmy = cos\ (2x − 60°)\ and\ \ x ∈ [-180° ; 180°]\kern2mm\ } $$
                                                                                 [ A 1.12 ]
     $$ \hspace*{2 mm}\mathrm{1.13\kern3mmy = cos\ (x + 30°)\ − 1\ and\ \ x ∈ [-180° ; 180°]\kern2mm\ } $$
                                                                                 [ A 1.13 ]
     $$ \hspace*{2 mm}\mathrm{1.14\kern3mmy = sin\ (x + 60°)\ + 1\ and\ \ x ∈ [-180° ; 180°]\kern2mm\ } $$
                                                                                 [ A 1.14 ]
     $$ \hspace*{2 mm}\mathrm{1.15\kern3mmy = tan\ x\ and\ \ x ∈ [-180° ; 180°]\kern2mm\ } $$                        [ A 1.15 ]
     $$ \hspace*{2 mm}\mathrm{1.16\kern3mmy = tan\ x\ =\ 1\ and\ \ x ∈ [-180° ; 180°]\kern2mm\ } $$                 [ A 1.16 ]
     $$ \hspace*{2 mm}\mathrm{1.17\kern3mmy = tan\ (x + 30°)\ and\ \ x ∈ [-180° ; 180°]\kern2mm\ } $$              [ A 1.17 ]
     $$ \hspace*{2 mm}\mathrm{1.18\kern3mmy = tan\ 2x\ and\ \ x ∈ [-90° ; 90°]\kern2mm\ } $$                          [ A 1.18 ]


        Question  2
       The figures show the graphs of the
       trigonometric functions given at each
       question. Use the information given in
       the figure to determine the values of
       the unknown variables :

     2.1   The graph of y = a sin k(x + p)
                                                                    [ A 2.1 ]
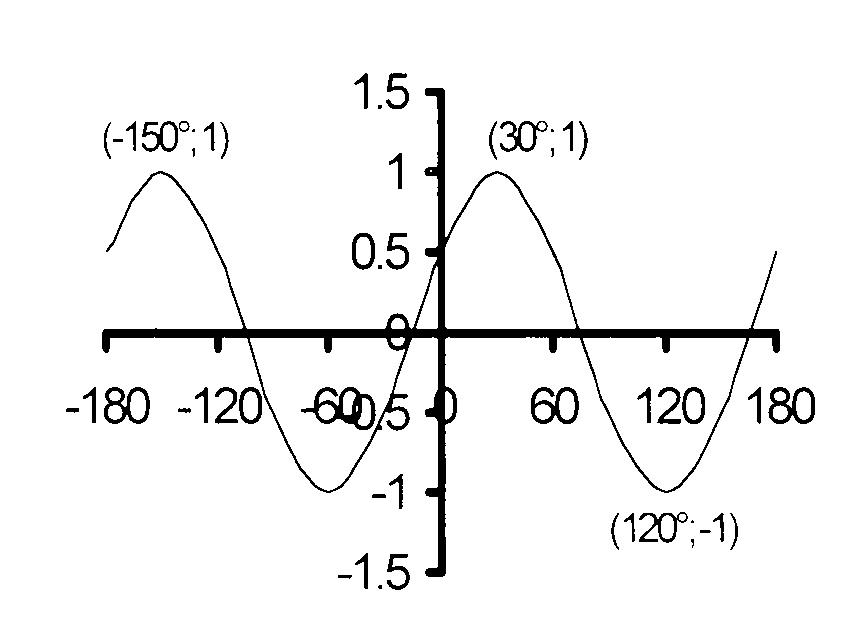
     2.2   The graph of y = a cos k(x + p)
                                                                    [ A 2.2 ]
     2.3   The graph of y = a sin k(x + p)
                                                                    [ A 2.3 ]
     2.4   The graph of y = a cos k(x + p)
                                                                    [ A 2.4 ]
     2.5   The graph of y = a sin k(x + p)
                                                                    [ A 2.5 ]
     2.6   The graph of y = a cos k(x + p)
                                                                    [ A 2.6 ]

        Question  3
     3.1  On the same set of axes draw the
            graphs of f(x) = sin (x − 30°) and
            g(x) = cos 2x for − 180° ≤ x ≤ 180°.
            Give the intercepts with the axes.       [ A 3.1 ]

     3.2  Give the period of f.                               [ A 3.2 ]

     3.3  Determine x by calculation if
            f(x) = g(x).                                                 [ A 3.3 ]

     3.4  For which value(s) of x
            will f(x) < -0,5?                                         [ A 3.4 ]

     3.5  For which value(s) of x
            will f(x) ≥ 0,5?                                        [ A 3.5 ]

        Question  4
       In the figure, the graphs of f(x) = a cos (x + b)
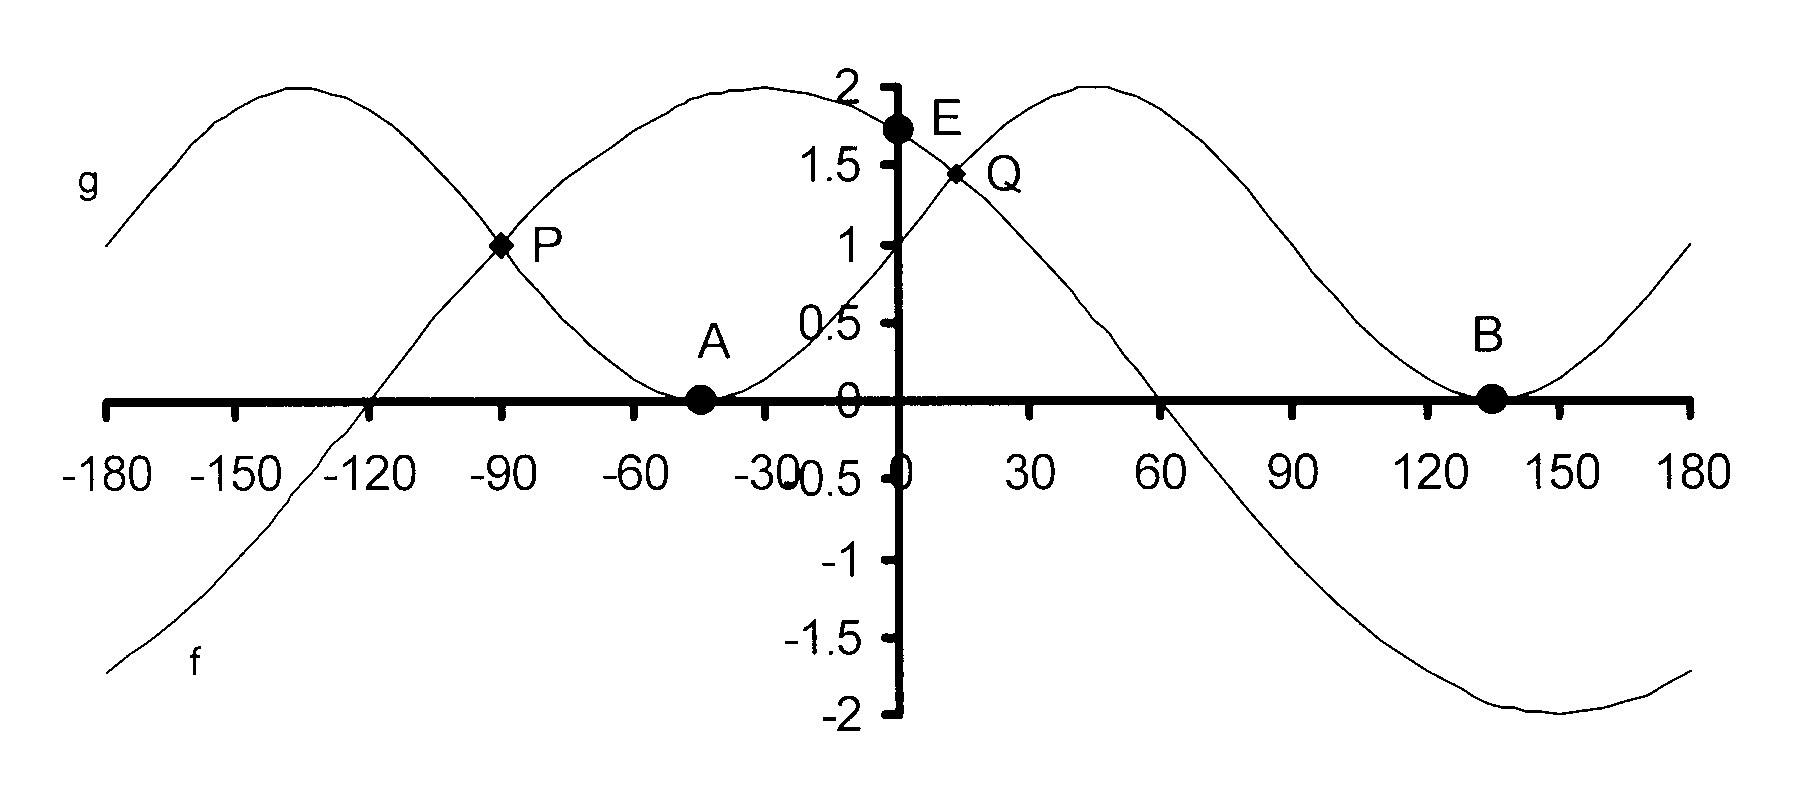
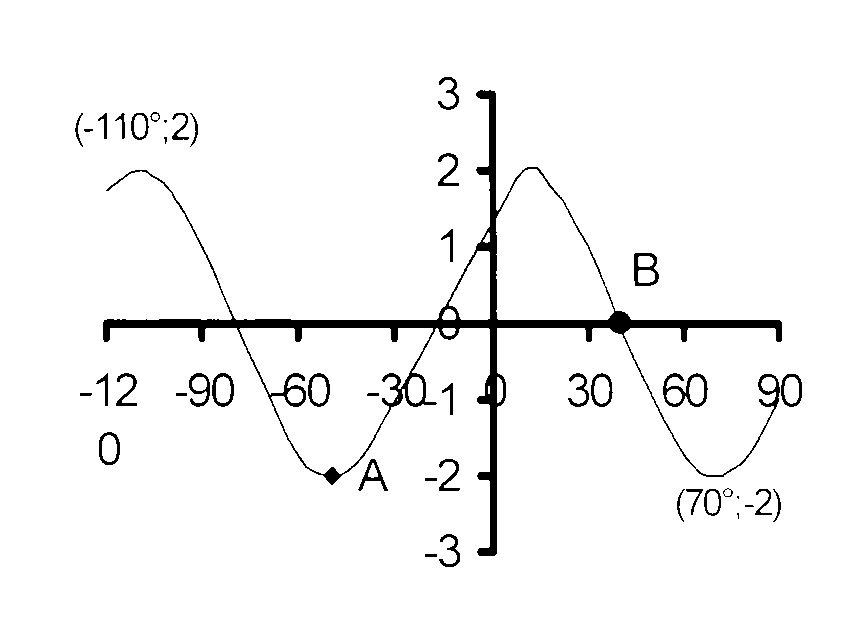
       and g(x) = c + sin dx for −180° ≤ x ≤ 180°
       are shown.

        4.1  Determine the values of a, b, c and d
               by using the graphs.                             [ A 4.1 ]

        4.2  Calculate the value of f(x) if x = 0° without
               using a calculator.                                 [ A 4.2 ]

        4.3  Determine x by using the graphs if
        4.3.1  g(x) = 2                                                 [ A 4.3.1 ]
        4.3.2  f(x) ≥ g(x)                                           [ A 4.3.2 ]

        4.4  The Y-axis is translated to pass
                through the turning point of f,
                where f(x) reaces a maximum.
                Determine an equationfor f in
                the form y = . . . with reference to
                the new set of axes.                               [ A 4.4 ]

        Question  5
       In the figure, the graphs of f(x) = a cos (x + b)
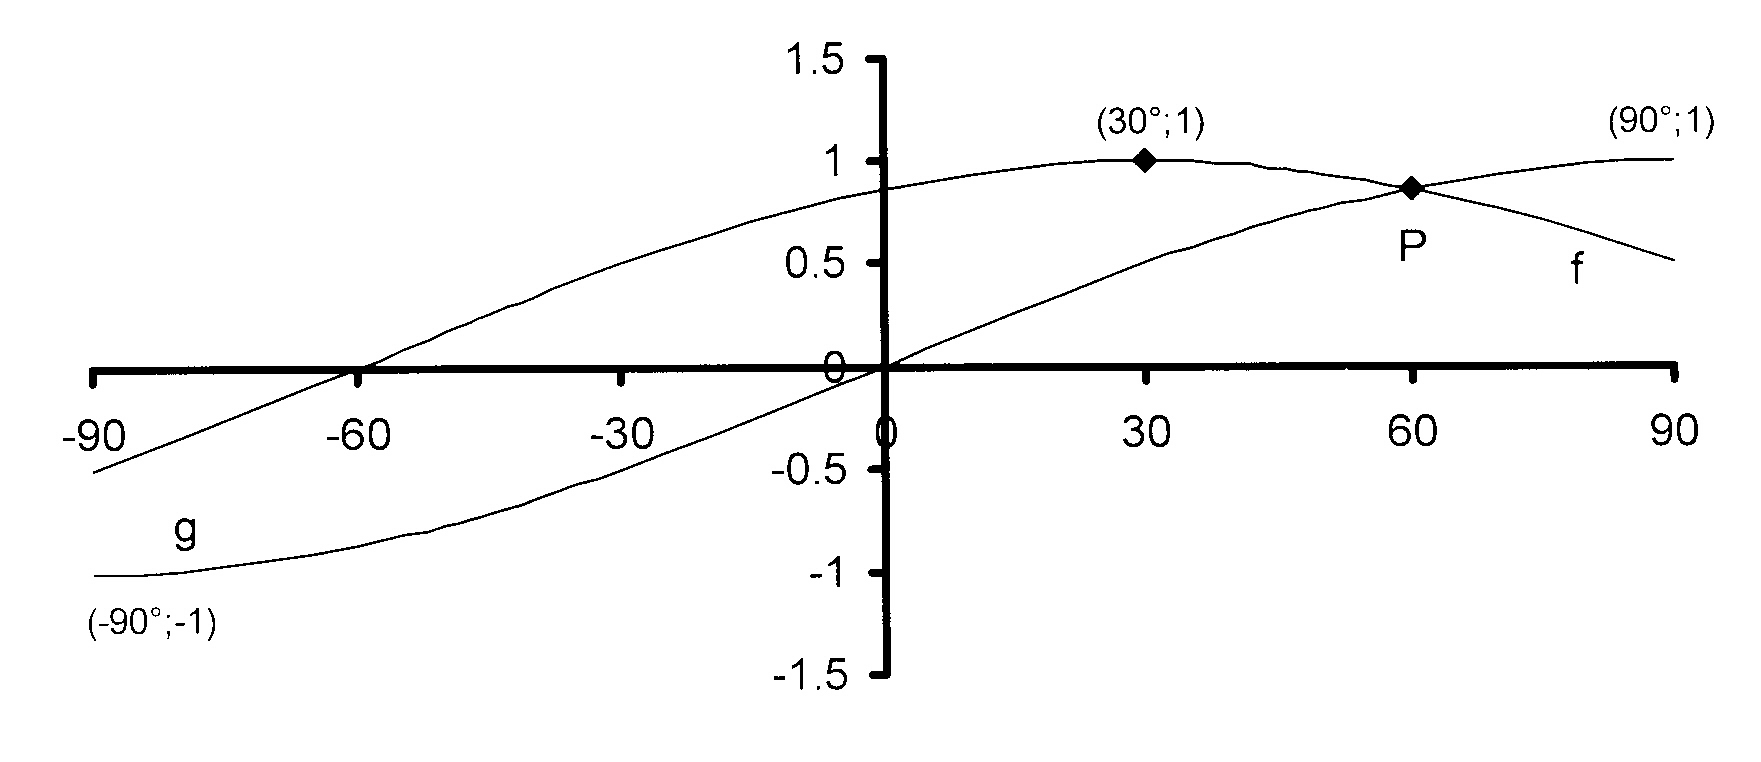
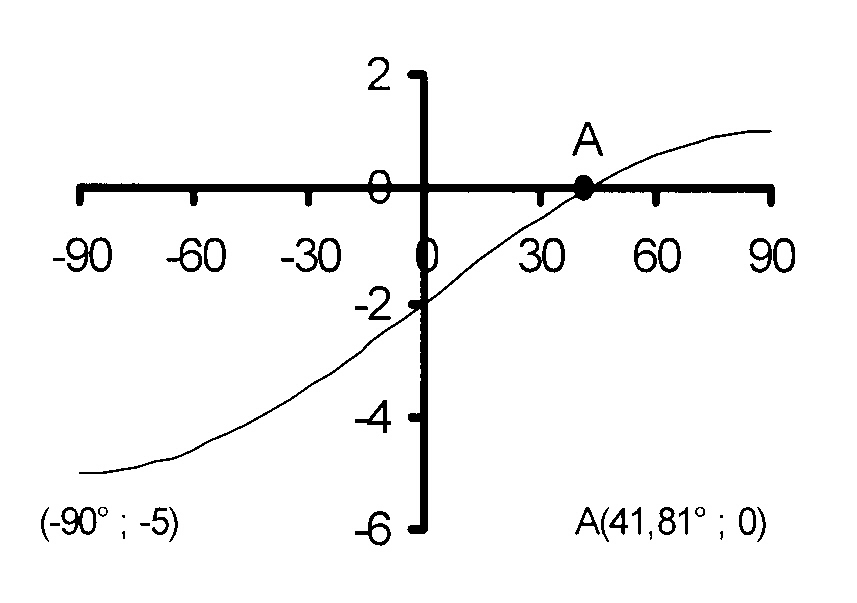
       and g(x) = sin cx for −90° ≤ x ≤ 90°
       are shown.

        5.1  Determine the values of a, b and c
               by using the graphs.                             [ A 5.1 ]

        5.2  Use the graphs to answer the
               following questions :
        5.2.1  Write down the range of f.              [ A 5.2.1 ]

        5.2.2  For what values of x is f(x)
                  decreasing as x increases?               [ A 5.2.2 ]

        5.2.3  If x ∈ [−90° ; 0°], for what values
                  of x is f(x).g(x) ≥ 0?                           [ A 5.2.3 ]

        5.3  If x ∈ [−90° ; 90°], solve the equation
               cos (x − 30°) = sin x and hence
               write down the values of x in the
               interval [−90° ; 90°] for which g(x) > f(x).
                                                                                [ A 5.3 ]

        5.4  The graph of h(x) is formed by
               translating the graph of g(x) 60° to
               the left. Wrire down the equation
               of h(x).                                                     [ A 5.4 ]

        5.5  How can the graph of f(x) be
               translated to form the graph of g(x)?
                                                                                [ A 5.5 ]

        Question  6
       In the figure, the graphs of f(x) = a cos (x + b)
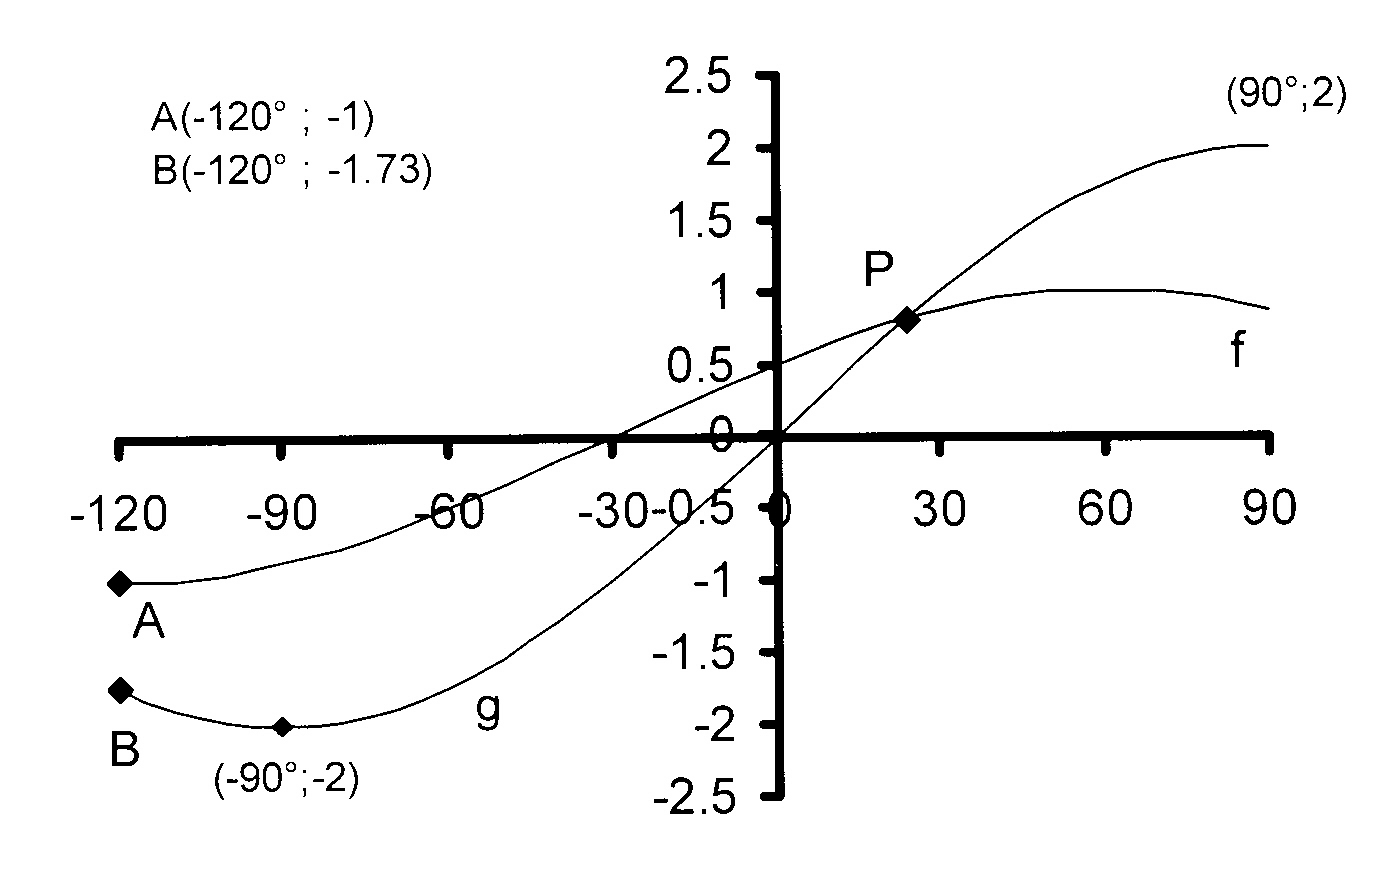
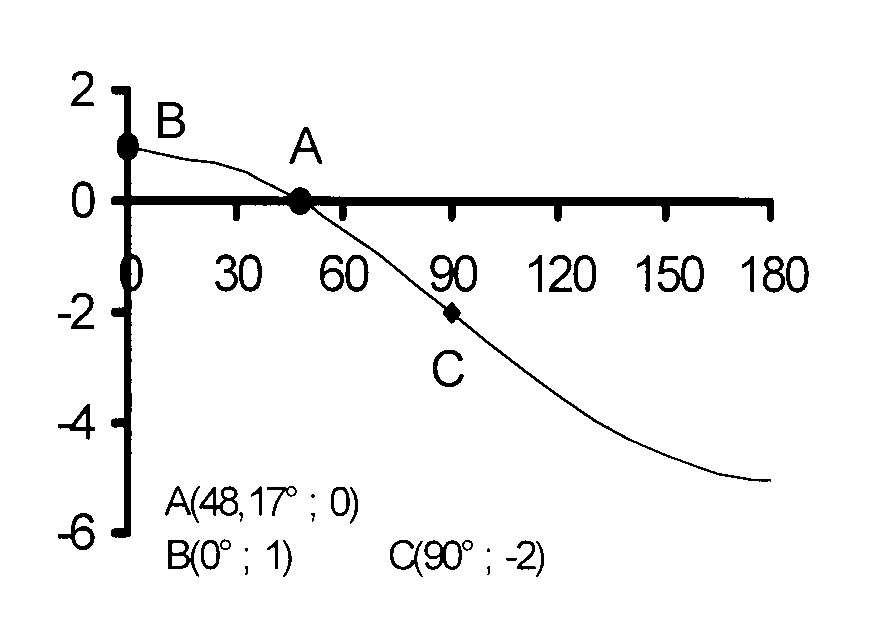
       and g(x) = c sin dx for −120° ≤ x ≤ 90°
       are shown.

        6.1  Write down the amplitude and
               period of g.                                             [ A 6.1 ]

        6.2  Determine the values of a, b, c
               and d.                                                      [ A 6.2 ]

        6.3  Write down the range of g.                [ A 6.3 ]

        6.4  Write down the value(s) of x < 0°
               for which f(x).g(x) ≥ 0.                       [ A 6.4 ]

        6.5  If the Y-axis is moved to the left so
               as to pass through the point of
               intersection of the given cosine curve
               and the X-axis, which function is now
               represented by the curve that initially
               represented the given sine function?
                                                                                [ A 6.4 ]

        Question  7
       In the diagram, the graphs of f(x) = cos x and
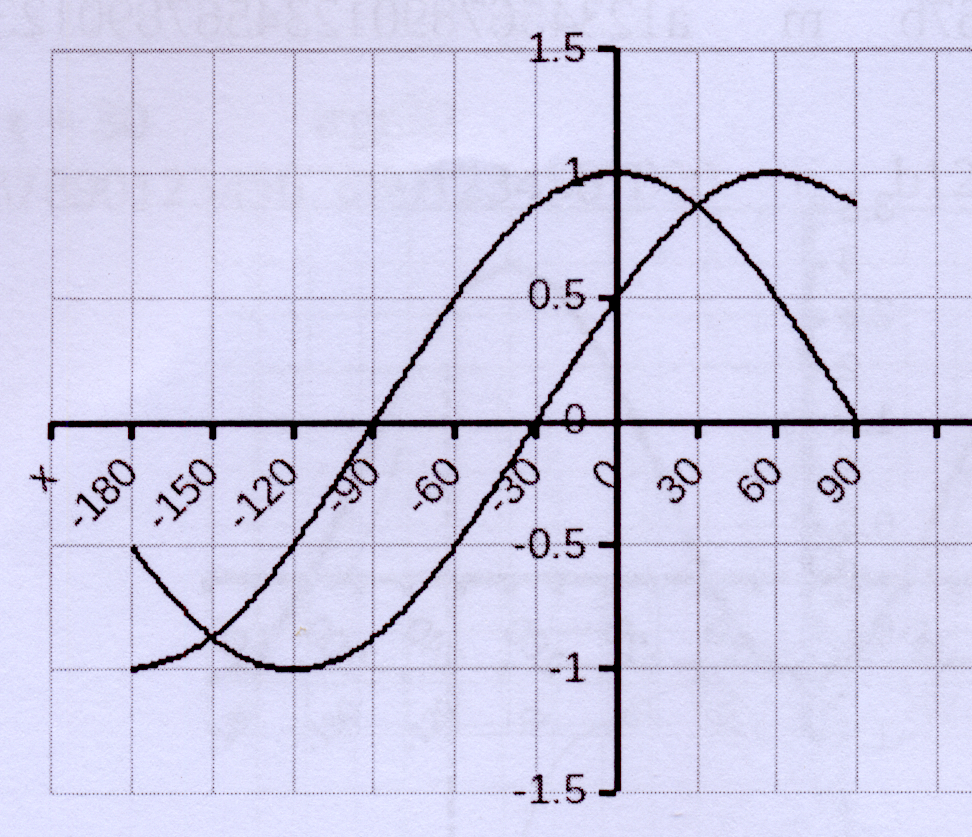
       and g(x) = sin (x + b) are drawn for the
       interval −180° ≤ x ≤ 90°

        7.1  Write down the value of b.                 [ A 7.1 ]

        7.2  Write down the period of g.                 [ A 7.2 ]

        7.3  Write down the value(s) of x in
               the interval − 180° ≤ x ≤ 90° for
               which f(x) − g(x) = 0                               [ A 7.3 ]

        7.4  For which values of x in
               the interval − 180° ≤ x ≤ 90°
        7.4.1  is sin (90° − x) > g(x)?                         [ A 7.4.1 ]
        7.4.2  is f(x).g(x) < 0?                                    [ A 7.4.2 ]
        7.4.3  is f(x).g(x) ≥ 0?                                  [ A 7.4.3 ]
        7.5  The graph of h is obtained by shifting
               f 3 units upwards. Determine the range of h.
                                                                                [ A 7.5 ]

        7.6  The graph of p is obtained by shifting
               f 3 units downwards. Write down the
               equation of p.                                        [ A 7.6 ]

        7.7  The graph of q is obtained by shifting
               f 30° to the left. Write down the
               equation of p.                                        [ A 7.7 ]


To the top Exercises - Grade 10 Exercises - Grade 11 Exercises - Grade 12 Home page
Afrikaanse oefening Oefeninge - Graad 10 Oefeninge - Graad 11 Oefeninge - Graad 12 Tuisblad